All entries for August 2018
August 21, 2018
Where in the World…?
Over the weekend I had a brief discussion with the other Dr Johnson in my house, who was asking me various questions about Exchanges, its metrics and readership. Okay, truth be told I started the conversation by wondering aloud about various aspects of our multiple audiences [1], as it’s a topic never too far from my mind, even on a road trip to the far south of the UK. I should mention, Mrs the Dr Johnson is a remote-sensing satellite and environmental monitoring specialist at another Midlands university, and I suspect tends to perceive the world through a geographic lens. Hence the construction of her question and interest. I’ll confess it wasn’t something I could immediately answer while driving down the M40, beyond making an assumption that our to-date core audience was located in and around Warwick, and perhaps Monash, given our concentration of editors and authors from those locations.
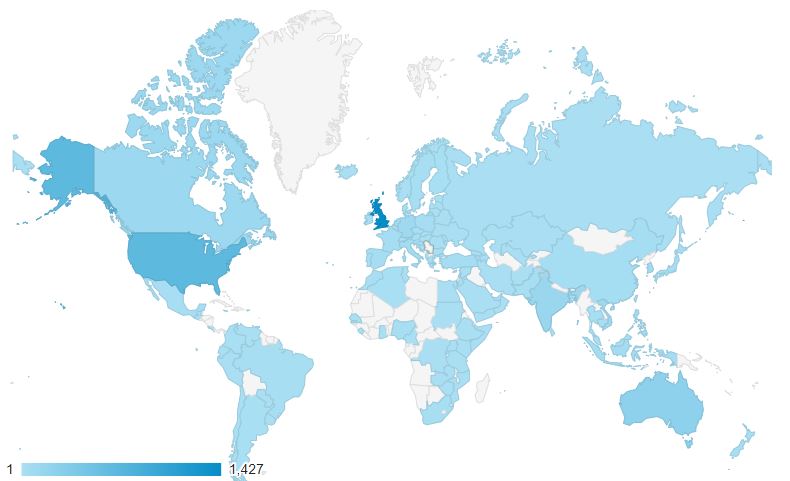 As I’ve discussed before, one of my (many) ambitions for Exchanges is to broaden the range of its audiences [2], and thinking about what we can find about the current audiences isn’t a bad place to start. I’ve two principal tools at my disposal for gathering this sort of data: Google Analytics (GA) and the Open Journal System’s (OJS) inbuilt statistics generator. The former looks a lot slicker and can churn out some pretty illuminating graphics at the click of a mouse, the latter’s UI and outputs are a lot more ‘web 1.0’ - in that creating a custom report is not a facile exercise and the platform spits out reams of largely unformatted, hard, numerical data. Both tools have their places in my working practices, for example at times it’s handy to have access and manipulate raw data, and GA doesn’t make scraping that in its entirety quite as easy. Conversely, when I need an illustrative graphic in short order for a presentation or report, GA is the tool I turn to.
The $64,000 question: does their data correlate? The answer is yes…and no. Broadly there’s some alignment, but the figures each one has presented me with are reasonably different in exact value if similar in relative magnitude. Given the issues with generating comparable data over the same period [3] it comes as no surprise to me that variance in ranking beyond the ‘big three’ UK, USA and Australia [4] exists. Perhaps more interesting are those countries which appear in one but not the other analytical tool’s top 10.
| Google Analytics | Open Journal Systems | |
| 1 | United Kingdom | United States |
| 2 | United States | United Kingdom |
| 3 | Australia | Australia |
| 4 | India | Vietnam |
| 5 | Canada | France |
| 6 | Vietnam | Russia |
| 7 | Germany | Germany |
| 8 | South Korea | South Korea |
| 9 | Philippines | India |
| 10 | Italy | Italy |
(countries appearing in both lists highlighted)
This might suggest, given GA has been running for less time than OJS’ current platform, that Canada and the Philippines are new and expanding audiences for Exchanges, with France and Russia diminishing. However, the precision in the time spans over which this data was gathered are both too limited to make such sweeping conclusions [5]. It is pleasing to see some non-Anglophone usage though in both charts, especially considering our sole language of publication is English.
Anyway, no matter the deeper implications of this very light touch look at Exchanges’ user statistics, I think I’ve at least answered part of Mrs Dr Johnson’s question about from where in the world our usage has originated. Naturally, this beggars another question which I can’t immediately answer: where SHOULD our audiences for the journal be coming from? As always, answers in the comments below please…
---
Endnotes
[1] Readers, authors, potential authors, stakeholders and more…I’m still work on defining these
[2] Does the ISS have an ISP I can track? If it has, another mission is to get this journal read in orbit!
[3] These issues are multiple. For examples, with OJS, when we moved to the newer version last year this, regrettably, seemed to ‘reset’ the statistics for the platform. We’ve a back record of these, but it’s no longer possible run off a complete set since the journal began. Likewise with Google Analytics, we’ve not had this running the whole time the platform has been up, so there’s going to be a temporal discrepancy there too. Added to that neither platform counts or creates its statistics in the same way, without a LOT of lengthy post-processing and normalisation, for normal usage there are always going to be disagreements on the ‘exact’ magnitude of visitations. Just one of the reasons as a qualitative researcher, I tend to maintain a certain analytical cynicism wherever ‘statistics’ are used to justify something: there’s always likely flaws, assumptions and simplifications in the underlying data acquisition methods!
[4] These make up 58.4% (GA) or 77.7% (OJS) of all usage
[5] It is possible I could make the data collection time frames marry better, but I’m still developing an understanding on how OJS works ‘under the hood’ in this respect. Something to return to at a later date, perhaps.
 Gareth Johnson
21 Aug 2018 11:01
|
Gareth Johnson
21 Aug 2018 11:01
| ![]() Tags: Access Analytics Audiences Geographic Google Ojs Statistics Users
|
Tags: Access Analytics Audiences Geographic Google Ojs Statistics Users
|  Comments (0)
|
Comments (0)
|  Report a problem
 Please wait - comments are loading
August 07, 2018
Summer Time Developments Brings DOIs, Paper Metrics & New Licence Terms
The month of August is the time of year when, traditionally, UK universities slow down a bit. It’s the summer holidays, so staff with families take the time to go on vacation, meaning many an email goes unanswered for a while and progress can seem sluggish. Personally, as a former academic librarian, August was the month I was often the busiest as all those project tasks and new academic year preparatory efforts were always in full swing! As Senior Editor of Exchanges, I felt this slight pause in email traffic and article ingest was the perfect time to push ahead on some the developmental work and background research advancing the journal for the benefit of our authors and readers alike.
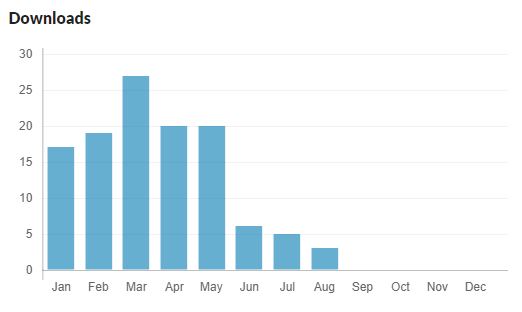
The most exciting new addition is that you can now see the downloads from the past year of all the articles on Exchanges. This is a great way for authors to track their papers’ engagement, not to mention for the Editorial Board to identify the areas in which our readers are most interested. This is our first step towards providing more information about how well the material published with us is being received, and over the next year, hopefully, I’ll be able to highlight further new information in this area.
Secondly, coming very soon will be DOIs for every article on Exchanges, both past and future. DOIs (digital object identifiers) are a unique alphanumeric string which provide a persistent lifetime link to a particular location on the internet, a shorthand if you like, for each article on Exchanges. This means even if we alter the journal’s website location or change our domain address, the DOI will remain a stable and viable way for readers to access an article. Additionally, I think they also make citing articles look a little tidier.
From today, we’ve also changed the Creative Commons author publishing licence for Exchanges, from the more restrictive Attribution-Non-Commercial-Sharealike (CC-BY-NC-SA), to the more desirable Attribution (CC-BY) only. The prior licence was considered the bare minimum to meet funders and governmental agencies around the world’s open access requirements. Shifting to a CC-BY licence brings us more in line with the major interdisciplinary titles, such as PLOS One, and further demonstrates Exchanges’ adherence to no-author-fee diamond model [1] open access publishing. Previously published, or submitted articles, will retain their original licences, as agreed by their authors. Newly submitting authors from now on, will be asked to accept the new licence terms at the point of submission, as part of their publishing agreement with Exchanges.
Behind the scenes I’ve also rolled out our very first author feedback system. This ties into my previously discussed interest in our author and reader audiences, and will provide some initial data towards satisfying that curiosity. It will also contribute by identifying aspects of Exchanges’ platform and process which work well, or less so, for our authors, directing my attention to where the greatest benefit can be achieved. If you’re one of our prior authors (vol 5.2), and you’ve had one of my emails about this, please do respond as it’s a very short set of questions which won’t take a lot of time. If you’ve already responded, many, many thanks!
Finally, a big welcome to the new members of our Editorial Board, who I know will make a considerable contribution to the running and engagement of the journal, and I’m really looking forward to working alongside them. Hopefully, I’ll be able to announce a few more additions to the team in the coming months, as the title continues to grow.
Hence, as you can see, the summer is continuing to be anything except quiet for Exchanges!
[1] As per Fuchs and Sandoval, although some might call this the ‘radical mode’, if they’re more a fan of Gary Hall’s work.
Gareth Johnson
07 Aug 2018 11:38
| ![]() Tags: Commons Creative Developments Doi Editors Licence License News Statistics Summer
| Comments (0)
| Report a problem
Tags: Commons Creative Developments Doi Editors Licence License News Statistics Summer
| Comments (0)
| Report a problem
 Loading…