All entries for Sunday 13 January 2013
January 13, 2013
Useless visualisation of data – logins.
Sometimes I like to see if I turn a bunch of data in to some sort of image. Not an image that's in any way useful for comprehending the data though. Just because.
Each square is one of 100000 instances of someone logging in to a computer (click to embiggen):
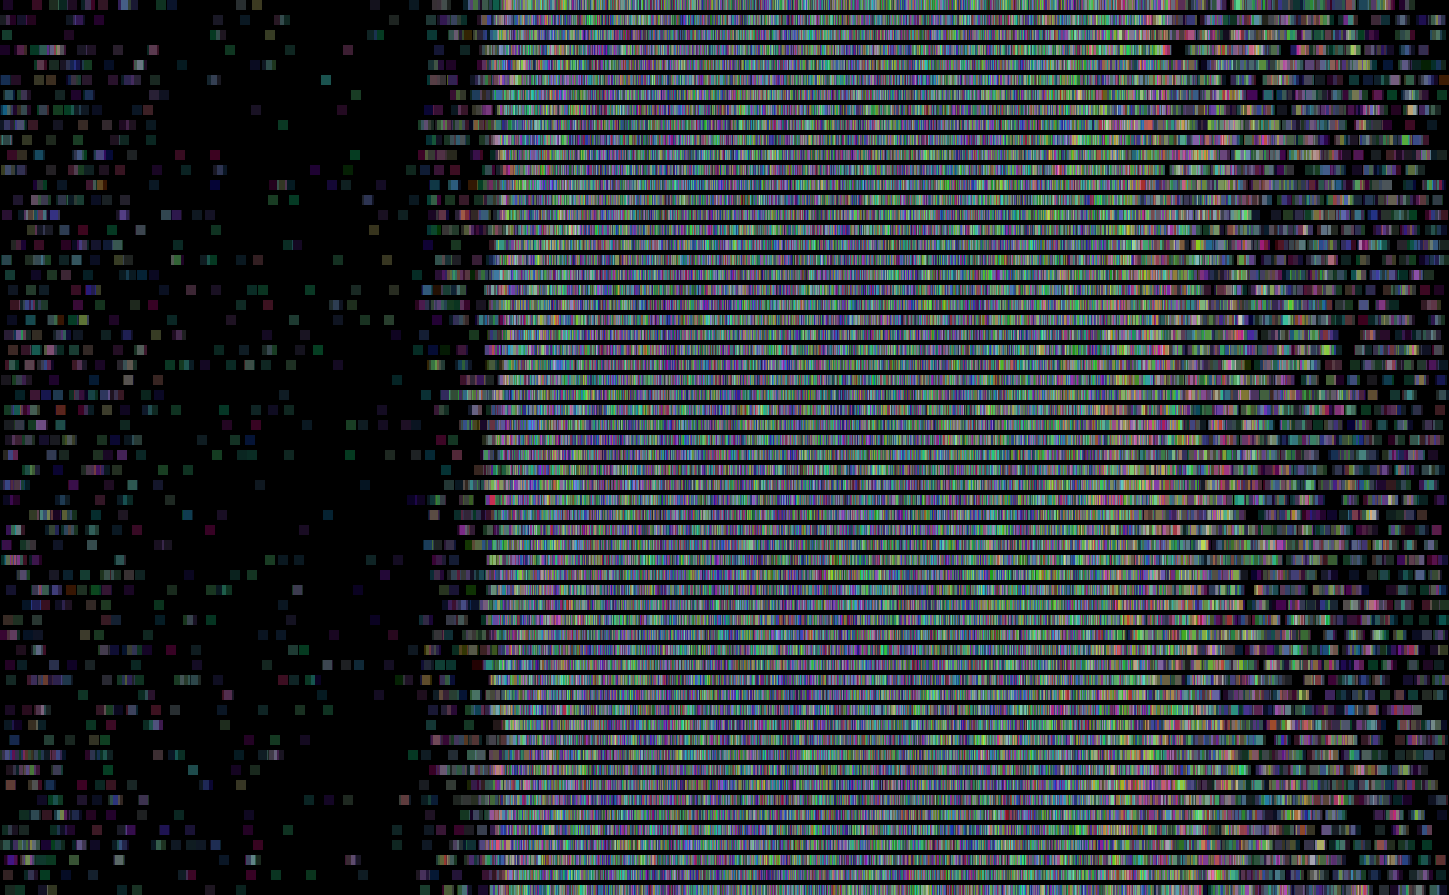
The position on the x axis represents the hour and minute at which the login occurred. Position on y axis is the seconds. The colour of each square is a function of the date, month and the IP address of the computer.
Each square is added to the image individually, placed over the top of whatever is already there. The opacity of each square is 50% and the blending method is Imagemagick's ModulusAdd. (The very first run I used 'Plus' and was briefly puzzled by the result being all white :) )
 Mike Willis
13 Jan 2013 22:19
|
Mike Willis
13 Jan 2013 22:19
| ![]() Tags: Imagemagick Pointless Visualisation
|
Tags: Imagemagick Pointless Visualisation
|  Comments (0)
|
Comments (0)
|  Report a problem
 Please wait - comments are loading