All 32 entries tagged Recession
View all 46 entries tagged Recession on Warwick Blogs | View entries tagged Recession at Technorati | There are no images tagged Recession on this blog
September 11, 2014
British Growth is Best in the World — Since When?
Writing about web page http://www.telegraph.co.uk/finance/economics/11036043/Top-of-the-world-UK-economy-winning-global-growth-race.html
Summary: On a restricted definition of "the world" (limiting it to our neighbours of similar size in northwestern Europe), British growth is best in the world since ... well, since 2012. This shouldn't count for much. More importantly, and perhaps surprisingly, British growth is also best in "the world" since the 1970s. To go on to a more tendentious point, the economy of the United Kingdom appears to be benefiting still from the relative growth advantage that it gained in the Margaret Thatcher years. I thought I'd mention this while the UK still exists.
Here's the full argument, with evidence. To start with, just how well is the UK economy doing at the moment? Here are the top three results of a Google search on "British growth best in world":
- Top of the world: UK economy winning global growth race (The Telegraph, 15 August 2014)
- UK economy now best in the world as new figures show (The Daily Mail, 15 August 2014)>
- Britain will be best performing of the world's largest economies in 2014 (The Guardian, 8 April 2014)
These have been recent headlines, but anyone with a little knowledge of recent economic history knows it's not so simple. The UK economy is growing fast, in part, because it is making a belated recovery from its deepest postwar recession, which began in 2008. In the crisis, the UK economy went down hard. As the crisis wore on the economy continued to perform dismally, with recovery continually postponed. In that setting, Britain's current rapid growth is no more than partial compensation for its underperformance earlier in the recession.
In other words, how well the British economy is performing today depends critically on when you start the clock. If you start it from yesterday, the British economy looks great. If you start from a few years back, its performance looks unimpressive at best.
How far back should you go? While the previous peak, in 2007, is a natural reference point, it is still only a few years ago. As an economic historian I'd prefer to take a longer view. How well is the British economy doing today, relative to other countries, if we shift the starting point still further back into the past? This is an easy thing to do, and it produces some surprises.
Here's what I did: I found figures for the real GDP of the United Kingdom and of five European neighbours, per head of the population. These neighbours are Belgium, France, Germany, Italy, and Netherlands. I chose these because they are not only nearby, but also because they are important trading partners, comparable to the UK in both income levels and economic size. The result is a small sample, but this is just a blog and I want to make a simple point. Anyone can repeat the exercise with more countries and then you will naturally find a more nuanced story. I looked at each country's growth rate comparing 2013 with every previous year: 2012, 2011, 2010, and so on, back to 1950. Germany is in the data, but only back to 1990, because before that it was two countries, and you cannot easily compare Germany today with West Germany in, say, 1970 or 1950. Finally, I worked out Britain's rank among the six countries (five before 1990) based on its growth rate up to 2013, starting from every one of the preceding years.
The chart below shows the result. It plots Britain's rank compared with our European benchmark competitors, based on growth rates of average incomes up to 2013, and it shows how that rank depends on the year you start from. In other words it answers the question: British growth is best in "the world" -- since when?

Source: Data for real GDP per head of the population in international (Geary-Khamis) dollars and 1990 prices are from The Conference Board Total Economy Database,January 2014,
Notes:
Each data point is the UK's relative position among five or six West European countries, based on the increase in real GDP per head in 2013 over its level in the base year shown. Countries are Belgium, France, Germany (from 1990, the year of East and West German reunification), Italy, Netherlands, and the United Kingdom. Because Germany is counted only from 1990, there are six countries from the present to 1990 (red squares), but only five before that year (blue squares).
Here's how to read the chart. As of 2013, Britain's growth is best in "the world" (OK, the little world of our Western European neighbourhood) since ... well, since 2012. But there is more! As of 2013, Britain's growth is also best in "the world" since 1995, 1994, ... and since every previous year right back to 1970. Now I'll discuss this in more detail.
If you measure Britain's growth over the last twelve months that are shown, from 2012 to 2013 Britain's performance was the best of the six countries. So, the red square on the far left puts Britain in first place out of six. For those who prefer numbers, here they are (and they remind us that economic recovery has been pretty anaemic everywhere):
- United Kingdom 0.8% growth of GDP/head, 2012 to 2013
- Germany 0.6%
- Belgium 0.0%
- France -0.3%
- Netherlands -0.9%
- Italy -1.1%
The chart also shows how Britain's relative position collapses as we move the starting point back to the beginning of the global crisis. Thus, the red squares to the right of 2012 and back to 2007 fall back to the second, third, and fourth ranks. If we start the growth story on the eve of the Great Recession, British growth to the present is nearly worst in "the world," ranked fifth (out of six):
- Germany 1.1% average annual growth of GDP/head, 2007 to 2013
- Belgium 0.3%
- France -0.5%
- Netherlands -0.8%
- United Kingdom -1.1%
- Italy -2.2%
Now for a surprise. As you take the starting point further back into the twentieth century, Britain's relative performance starts to look better and better. The red and then blue squares reflect this by rising back up to show Britain recovering to fourth, third, and second place, and eventally back to first place. If, for example, you wind the clock right back to 1979, the year that Margaret Thatcher took office, then British growth from that year to the present is faster than of any of the other European economies in the sample (which now excludes Germany). Here are the figures:
- United Kingdom 1.9% average annual growth of GDP/head, 1979 to 2013
- Belgium 1.7%
- Netherlands 1.5%
- France 1.2%
- Italy 1.0%
Note: Britain's relative growth advantage is seen for a whole run of starting points, beginning in 1995 and ending in 1970. This does not mean that the turnaround in Britain's fortunes began in 1970, for in the 1970s British economic performance remained relatively poor. The turnaround began in the 1980s under Margaret Thatcher. At that time Britain began to grow faster, just as our European neighbours decelerated. The way our chart looks at things, however, the benefits of that turnaround cast a beneficial "shadow" back onto earlier years, considered as starting points for the measurement of growth.
Finally, you can push the starting point right back into the 1960s and 1950s, but eventually relatively slow British growth in the so-called Golden Age of Brettton Woods takes its toll, so that Britain's ranking slips back down again to the bottom. Here are the last figures:
- Italy 2.7% average annual growth of GDP/head, 1950 to 2013
- Belgium 2.4%
- France 2.3%
- Netherlands 2.2%
- United Kingdom 2.0%
Note: There's a surprise here for Italians. In almost all these estimates Italian growth has been worst in "the world"; notoriously, Italian incomes have marked time over the last 20 years. The surprise is that if you measure growth since 1950, Italian performance shows up as best in "the world"! That's the legacy of a postwar economic miracle: Italian incomes tripled in just two decades from 1950 to 1970.
Here's my bottom line. Just how good is British economic performance today? The answer depends critically on "Since when?"
- The British economy has done relatively well since 2011, outpacing our nearest European competitors. But this is no surprise, because British economic performance was so spectacularly poor in earlier years of the Great Recession.
- The British economy has done relatively well since the 1970s, and this deserves greater recognition. Even today, despite the dismal experience of the Great Recession, the British economy continues to benefit from its reversal of fortunes under Margaret Thatcher.
 Mark Harrison
11 Sep 2014 15:06
|
Mark Harrison
11 Sep 2014 15:06
| ![]() Tags: Economics Recession Thatcher Using-Data
|
Tags: Economics Recession Thatcher Using-Data
|  Comments (0)
|
Comments (0)
|  Report a problem
 Please wait - comments are loading
October 15, 2012
Markets versus Government Regulation: What are the Tail Risks?
Writing about web page http://ideas.repec.org/a/aea/jeclit/v45y2007i1p5-38.html
Tail risks are the risks of worst-case scenarios. The risks at the far left tail of the probability distribution are typically small: they are very unlikely, but not impossible, and once or twice a century they will come about. When they do happen, they are disastrous. They are risks we would very much like to avoid.
How can we compare the tail risks of government intervention with the tail risks of leaving things to the market? Put differently, what is the very worst that can happen in either case? Precisely because these worst cases are very infrequent, you have to look to history to find the evidence that answers the question.
To make the case for government intervention as strong as possible, I will focus on markets for long-term assets. Why? Because these are the markets that are most likely to fail disastrously. In 2005 house prices began to collapse across North America and Western Europe, followed in 2007 by a collapse in equity markets. By implication, these markets had got prices wrong; they had become far too high. The correction of this failure, involving large write-downs of important long term assets, led us into the credit crunch and the global recession.
Because financial markets are most likely to fail disastrously, they are also the markets where many people now think someone else is more likely to do a better job.
What's special about finance? Finance looks into the future, and the future is unexplored territory. Only when that future comes about will we know the true value of the long-term investments we are making today in housing, infrastructure, education, and human and social capital. But we actually have no knowledge what the world will be like in forty or even twenty years' time. Instead, we guess. What happens in financial markets is that everyone makes their guess and the market equilibrium comes out of these guesses. But these guesses have the potential to be wildly wrong. So, it is long-term assets that markets are most likely to misprice: houses and equities. When houses and equities are priced very wrongly, chaos results. (And in the chaos, there is much scope for legal and illegal wrongdoing.)
When housing is overvalued, too many houses are built and bought at the high price and households assume too much mortgage debt. When equities are overvalued, companies build too much capacity and borrow too much from lenders. To make things worse, when the correction comes it comes suddenly; markets in long term assets don't do gradual adjustment but go to extremes. In the correction, nearly everyone suffers; the only ones that benefit are the smart lenders that pull out their own money in time and the dishonest borrowers that pull out with other people’s money. It's hard to tell which we resent more.
If markets find it hard to price long term assets correctly, and tend to flip from one extreme to another, a most important question then arises: Who is there that will do a better job?
It's implicit in current criticisms of free-market economics that many people think like this. Financial markets did not do a very good job. It follows, they believe, that someone else could have done better. That being the case, some tend to favour more government regulation to steer investment into favoured sectors. Others prefer more bank regulation to prick asset price bubbles in a boom and underpin prices in a slump. The latter is exactly what the Fed and the Bank of England are doing currently through quantitative easing.
Does this evaluation stand up to an historical perspective?
We’re coming through the worst global financial crisis since 1929. Twice in a century we've seen the worst mess that long-term asset markets can make -- and it's pretty bad. A recent estimate of the cumulative past and future output lost to the U.S. economy from the current recession, by David H. Papell and Ruxandra Prodan of the Boston Fed, is nearly $6 trillion dollars, or two fifths of U.S. output for a year. A global total in dollars would be greater by an order of magnitude. What could be worse?
For the answer, we should ask a parallel question about governments: What is the worst that government regulation of long term investment can do? We'll start with the second worst case in history, which coincided with the last Great Depression.
Beginning in the late 1920s, the Soviet dictator Stalin increasingly overdid long term investment in the industrialization and rearmament of the Soviet Union. Things got so far out of hand that, in Russia, Ukraine, and Kazakhstan in 1932/33, as a direct consequence, 5 to 6 million people lost their lives.
How did Stalin's miscalculation kill people? Stalin began with a model that placed a high value (or “priority”) on building new industrial capacity. Prices are relative, so this implied a low valuation of consumer goods. The market told him he was wrong, but he knew better. He substituted one person’s judgement (his own) for the judgement of the market, where millions of judgements interact. He based his policies on that judgement.
Stalin’s policies poured resources into industrial investment and infrastructure. Stalin intended those resources to come from consumption, which he did not value highly. His agents stripped the countryside of food to feed the growing towns and the new workforce in industry and construction. When the farmers told him they did not have enough to eat, he ridiculed this as disloyal complaining. By the time he understood they were telling the truth, it was too late to prevent millions of people from starving to death.
This case was only the second worst in the last century. The worst episode came about in China in 1958, when Mao Zedong launched the Great Leap Forward. A famine resulted. The causal chain was pretty much the same as in the Soviet Union a quarter century before. Between 1958 and 1962, at least 15 and up to 40 million Chinese people lost their lives. (We don’t know exactly because the underlying data are not that good, and scholars have made varying assumptions about underlying trends; the most difficult thing is always to work out the balance between babies not born and babies that were born and starved.)
This was the worst communist famine but it was not the last. In Ethiopia, a much smaller country, up to a million people died for similar reasons between 1982 and 1985. If you want to read more, the place to start is “Making Famine History” by Cormac Ó Gráda in the Journal of Economic Literature 45/1 (2007), pp. 5-38. The RePEc handle of this paper is http://ideas.repec.org/a/aea/jeclit/v45y2007i1p5-38.html.
Note that I do not claim these deaths were intentional. They were a by-product of government regulation; no one planned them (although some people do argue this). At best, however, those in charge at the time were guilty of manslaughter on a vast scale. In fact, I sometimes wonder why Chinese people still get so mad at Japan. Japanese policies in China between 1931 and 1945 were certainly atrocious and many of the deaths that resulted were intended. Still, if you were minded to ask who killed more Chinese people in the twentieth century, the Japanese imperialists might well have to cede first place to China's communists. However, I guess there is less national humiliation in it when the killers are your fellow countrymen than when they are foreigners.
To conclude, no one has the secret of correctly valuing long term assets like housing and equities. Markets are not very good at it. Governments are not very good at it either.
But the tail risks of government miscalculation are far worse than those of market errors. In historical worst-case scenarios, market errors have lost us trillions of dollars. Government errors have cost us tens of millions of lives.
The reason for this disparity is very simple. Markets are eventually self-correcting. "Eventually" is a slippery word here. Nonetheless, five years after the credit crunch, worldwide stock prices have fallen, house prices have fallen, hundreds of thousands of bankers have lost their jobs, and democratic governments have changed hands. That's correction.
Governments, in contrast, hate to admit mistakes and will do all in their power to persist in them and then cover up the consequences. The truth about the Soviet and Chinese famines was suppressed for decades. The party responsible for the Soviet famine remained in power for 60 more years. In China the party responsible for the worst famine in history is still in charge. School textbooks are silent about the facts, which live on only in the memories of old people and the libraries of scholars.
Mark Harrison
15 Oct 2012 12:22
| ![]() Tags: China Economics History Politics Recession Russia Stalin
| Comments (0)
| Report a problem
Tags: China Economics History Politics Recession Russia Stalin
| Comments (0)
| Report a problem
April 24, 2012
Political Costs of the Great Recession
Writing about web page http://www.ft.com/cms/s/0/5b1b5556-8d1d-11e1-9798-00144feab49a.html#axzz1styV0LMT
Monday's Financial Times recorded the dismal showing of Nicolas Sarkozy in the French Presidential first-round election, the record vote for France's far-right National Front, and the openings to the right of Sarkozy and François Hollande, who remain in the contest, as they compete to sweep up the votes of the eliminated candidates.
It reminded me of a recent NBER working paper by Alan de Bromhead, Barry Eichengreen, and Kevin O'Rourke on Right-wing Political Extremism in the Great Depression. (There's a non-technical summary on VOXeu.) What these authors show is that the rise of right wing extremism in the Great Depression was not just a German phenomenon. They define extremist parties as those that campaigned to change not just policy but the system of government. They look at 171 elections in 28 countries spread across Europe, the Americas, and Australasia between 1919 and 1939. They find that a swing to right-wing "anti-system" parties was more likely where the depression was more prolonged, where there was a shorter history of democracy, and where fascist parties were already represented in the national parliament. In short, de Bromhead and co-authors conclude, the Depression was "good for fascists."
I don't mean to imply that either Sarkozy or Hollande are fascists. They aren't. Neither of them wants to replace electoral democracy by authoritarian rule. But they are responding to the protest vote in their own country by proposing "solutions" to the problems of the already weakened French market economy that will weaken it further by increasing government entitlement spending, government regulation, and tax rates.
Where does the protest vote come from? There is anger and pessimism. There is a search for alternatives to free-market capitalism and representative democracy. The problem is that all the alternatives are worse. But none of the candidates (perhaps with the exception of François Bayrou, who did badly) has been willing to say this.
How do we know that all the alternatives are worse? We know it from history.
The chart below shows the total real GDPs of twelve major market economies from 1870 to 2008 (the countries are Australia, Austria, Belgium, Canada, Denmark, Finland, France, Germany, Italy, Netherlands, New Zealand, Norway, Sweden, Switzerland, United Kingdom, and United States; data are by the late Angus Maddison at http://www.ggdc.net/maddison/). The vertical scale is logarithmic, so the slope of the line measures its rate of growth.

You can see two things. One is the steadiness of economic growth in the West over 140 years up to the recent financial crisis. The other is that two World Wars and the Great Depression were no more than temporary deviations. They are just blips in the data. For many people they were hell to live through (and sometimes these were the lucky ones), but in the long run the economic consequences went away. In fact, recent work by the economic historian Alexander J. Field has shown that the depressed 1930s were technologically the most dynamic period of American history.
One conclusion might be that the economic consequences of the current recession are not the ones that we should fear most. I don't mean that the economic losses arising from reduced incomes and unemployment are trivial; life today is unexpectedly hard for millions of people, young and old. Young people, even if they will not be a "lost" generation, will suffer and be scarred by the experience. If you're old enough, you could be dead before better times come round again. At the same time, the kind of pessimism that says that our children will be never be as well off as we were is groundless. The economic losses associated with the recession will eventually evaporate, just as the economic losses of the Great Depression went away in the long run.
We should be more afraid of the lasting political consequences. The effects of the Great Depression on politics were very deep and very persistent. World War I ended with the breakup of the German, Austro-Hungarian, Romanov, and Ottoman Empires. In the 1920s, most of the new countries that were formed became democracies. Then, we had the Great Depression. Across Europe there was anger, pessimism, and a search for alternatives to free-market capitalism and representative democracy. By the end of the 1930s Europe had recovered economically from the depression but most of the new democracies had fallen under dictators. That led to World War II, in which as many as 60 million people were killed. Fascism was defeated, but then Europe was divided by communism and that led to the Cold War.
It took until 1989 for the average of democracy scores of European countries (measured from the Polity IV database) to return to the previous high point, which was in 1919.
In short, the Great Depression stimulated a search for alternatives to liberal capitalism. This search was extremely costly and completely pointless. For a while in various quarters there was admiration for Hitler, Mussolini, or Stalin, their great public works, their capacity to inspire and to mobilize, and their rebuilding of the nation. But both fascism and communism turned out to be terrible mistakes.
Memories are short. Today's politicians want your vote. And many voters want to hear that some radical politician or authority figure has a quick fix for capitalism. It seems like we may have to learn from our mistakes all over again. Let's hope that the lesson is less costly this time round.
Mark Harrison
24 Apr 2012 22:04
| ![]() Tags: Economics Hitler Politics Recession Stalin
| Comments (1)
| Report a problem
Tags: Economics Hitler Politics Recession Stalin
| Comments (1)
| Report a problem
November 30, 2011
The Return of DIY Economics
Writing about web page http://www.ft.com/indepth/autumn-statement-growth-review-2011
Some years ago, David Henderson coined the phrase"do it yourself economics." DIY economics, he argued, was made up of the practical models of causation that ordinary people use to understand the economic world around them. In the world of DIY economics, he noted, public spending and exports are good because they create jobs;industry is more deserving of support than services; cheap goods made by foreigners are a curse, not a blessing; and whatever the problem is, the government ought to do something.
DIY economics is clearly expressed in responses to yesterday's autumn statement by the Chancellor. I'm going to comment on just one aspect: the length of causal chains. In the world of DIY economics there is never more than one step from cause to effect. I will give two examples, one concerning the burden of taxes and another concerning the housing market.
First, who bears the burden of taxes? In the world of DIY economics, if you tax the rich and give a benefit to the poor, the rich become poorer and the poor become richer. Full stop. In other words, the burden of taxes is borne by those that write the cheques. The converse must also be the case, as Polly Toynbee argues in this morning's The Guardian:
George Osborne's autumn statement blatantly declares itself for the few against the many ... What was missing from his list? Not one penny more was taken from the top 10% of earners. Every hit fell upon those with less not more. Fat plums ripe for the plucking stayed on the tree as the poorest bore 16% of the brunt of new cuts and the richest only 3%.
The chain of causation suggested by modern economics is somewhat longer, yet each step is still simple and transparent. The burden of taxes is spread beyond those that write the cheques to the government. Ultimately, who pays for a tax on profits? A tax on profits increases the cost of capital to firms, so that less capital is employed and every worker is less productive. The result is lower wages (as well as lower profits). A tax on labour increases the cost of labour to firms, so that fewer workers are employed. The result is fewer jobs (as well as lower wages and profits).
In short, who writes the cheque is a poor guide to whether a particular tax will help the poor. Whether taxes are levied on capital or labour, the workers bear much of the cost, which is likely to exceed the revenue raised.
Second, who should we blame for the mess that George Osborne is trying to tackle? In the world of DIY economics, there is only one step from cause to effect. So, if you see the effect, you only have to go one step back to find the cause. The recession began with a credit crunch, so the suppliers of credit, the bankers, are to blame for everything. Most certainly, we are not to blame. This morning, as public sector workers strike to protect their pensions, my facebook page is full of comments that replicate the following confident assertion:
Remember when Teachers, Policemen, Police staff,Ambulance staff, Nurses, Midwives, Doctors and Fireman crashed the stock market, wiped out Banks, took billions in bonuses and paid no tax? No, me neither. Please copy and paste to status for 24 hours to show your support against the government's latest attack on pensions and public sector workers.
Behind this, however, lies a longer chain of causation that implicates us all. Where did the credit crunch come from?* The sub-prime housing market. Mortgage lenders in western economies had overextended credit to households that had no hope of repaying from their incomes. What provided the impetus to excess housing credit? Well meaning government policies that had responded to rising inequality by promoting and subsidizing "affordable" housing (actually the opposite). Bankers and mortgage lenders colluded actively with this, of course. So I'm not particularly delighted that part of the British government's strategy for economic revival is new help for homebuyers. Haven't we been here before?
Then, why did the housing crash ripple so devastatingly through the economy? Because the same governments had already given up their room for fiscal manoeuvre by bloating their public sector wage bills and unfunded pension promises. (Promises to whom? Oh! Teachers, policemen, ambulance staff, nurses, midwives, doctors and firemen.)
So, Mr or Mrs Public Sector Worker: No, I don't let you off the hook. In fact, no one should feel free of responsibility. I might blame the last Labour government, but somebody must have voted them in. (It might have been me.)
Not everyone will agree with this diagnosis. In the real world, causal chains are long and complex. For the same reason, they are also generally uncertain. That is enough reason for disagreement, before we get around to ignorance, bias, and vested interests! The one claim I make confidently, however, is that one-step causation is rarely enough.
* To anyone who wants to read more, I recommend any of the following. There's an American tilt in my list; I don't think our own investigators have done a good job yet (but more recommendations are welcome).
- Gretchen Morgenson and Joshua Rosner, Reckless Endangerment: How Outsized Ambition, Greed, and Corruption Led to Economic Armageddon (Time Books, 2011).
- Raghuram Rajan, Fault Lines: How Hidden Fractures Still Threaten the World Economy (Princeton University Press, 2010)
- John B. Taylor, Getting Off Track: How Government Actions and Interventions Caused, Prolonged and Worsened the Financial Crisis (Hoover Press, 2009).
Mark Harrison
30 Nov 2011 08:14
| ![]() Tags: Economics Politics Recession
| Comments (7)
| Report a problem
Tags: Economics Politics Recession
| Comments (7)
| Report a problem
October 31, 2011
Plan B or not to B
Writing about web page http://clients.squareeye.net/uploads/compass/documents/Compass_Plan_B_web.pdf
Plan B was launched over the weekend to much fanfare. There was much excited analysis in The Guardian. In The Observer, one hundred economists told George Osborne that Plan A is failing.
I will focus on one small aspect, the Plan B critique of current fiscal policies. Behind Plan B is the idea that "current policies … may do the very opposite of their avowed intention, by actually increasing the deficit." The logic underlying this argument extends he Keynesian multiplier: public spending cuts put people out of jobs and reduce their incomes, so that they pay less in tax; if taxes fall by more than spending, the deficit will widen, ending in higher, not lower public debt. Turn this argument around and there would be scope, apparently, for Britain to spend its way out of debt.
Another idea behind Plan B is that "the UK national debt is not large by long-run historical standards." Judging from the historical record, it seems, Britain can easily afford a higher public debt. While debt reduction may sound virtuous, it is suggested, it is currently unecessary (and the policies designed to achieve it may be actively harmful).
The outcome of Plan A, according to Plan B, is economic "sado-masochism": We are enduring the pain of public spending cutbacks to no purpose (since the cutbacks will not reduce the deficit) when the purpose (to reduce the public debt) is not even necessary in the first place. Or is there pleasure for some in the pain of others?
This weekend, by coincidence, the Royal Economic Society Newsletter (no. 155, October 2011) published my short paper Surely You're Joking, Mr Keynes?This paper makes two points.
First, it's true that Britain has carried much larger debts relative to its GDP in the past, but this was almost entirely the result of wars; do we have a comparable excuse today? It's completely unhistorical, moreover, to compare Britain's credit today with that obtainable when Britain was the world's dominant economic and financial power. The world has changed; is that something we still need to get used to?
On this, I conclude:
Historically, having a debt twice the size of the national income has been a sign that something went terribly wrong: a run of major wars, for example. Faced with the worst recession in 80 years, the British government was right to let its budget go into deficit temporarily. At that moment an increase in Britain’s debt was inevitable. Now it looks essential to bring it back under control over a few years.
Second, there is no robust evidence in the historical data that deficit reduction is self-defeating. There is claimed to be evidence, but I show that it crumbles when you touch it. On average, in fact, deficit reduction has reduced the national debt -- as one would expect.
Here, I conclude:
It remains true that, once the public debt is set on a particular course, it is hard to change that course quickly. But this is only momentum that takes time to reverse; there is no evidence of destabilizing pushback from Keynesian multipliers.
To sum up: I have taken aim at two common beliefs about the British public finances. One is that we should borrow our way out of recession; the other is that we can spend our way of debt. These beliefs are based on intriguing stories. But, like many good stories, they are fictions. Our country cannot spend its way out debt. In today’s world, we can afford to borrow much less than in the past, and that may be just as well.
Mark Harrison
31 Oct 2011 15:26
| ![]() Tags: Economics Politics Recession
| Comments (4)
| Report a problem
Tags: Economics Politics Recession
| Comments (4)
| Report a problem
September 08, 2011
Britain's 50p Tax Rate: The Evidence Against
Writing about web page http://www.ft.com/cms/s/0/d92b0bc4-d7e9-11e0-a5d9-00144feabdc0.html
On his excellent blog Analysing British Politics, my Warwick colleague Wyn Grant (with whom I taught The Making of Economic Policy last year) has announced: Economists disagree shock. Yesterday, nineteen other economists and I signed a letter in the Financial Times urging a rapid retreat from Britain's "temporary" 50p tax rate on higher incomes. Today, two more economists (Alan Manning of LSE and Warwick's own Andrew Oswald) have responded, noting that the evidence linking personal location decisions to marginal tax rates is unimpressive. Wyn points out, also, that the precise fiscal effects of the 50p tax rate will not be known for some time.
It is no surprise to find that economists disagree. Wyn and I teach on our course that the world is complex; we often remain uncertain about exactly how causation works, even long after the event. Uncertainty is not the same as total ignorance, however. While the letter that I signed emphasized the tax competition argument against the 50p tax rate, I supported the argument on other grounds for which there exist clear empirical foundations. Because economic causation is uncertain, there is also contrary evidence. I place particular emphasis on the evidence I've selected, partly because I regard those that have produced it as fine scholars.
First, those who support higher income taxation appear to ignore the price we pay in economic welfare. With rare exceptions, taxes distort the allocation of resource and worsen economic efficiency. Some do this more than others. We can rank them by the losses they cause per unit of revenue raised. It turns out that taxes on immovable property cause the smallest losses, followed by consumption taxes and taxes on movable property. Taxes on personal income cause more losses than any of these. Only profit taxes are worse from this point of view. This finding is from work by Åsa Johansson, Christopher Heady, Jens Arnold, Bert Brys, and Laura Vartia, based on data from 21 OECD countries, 1970 to 2005: "Tax and Economic Growth," OECD Economics Department Working Paper No. 620 (2008).
Second, those who think it's okay for the Exchequer to grab some extra money every now and then from the rich, or from banks or oil companies, ignore the price we pay for a volatile, unpredictable tax regime. When businesses contemplate long-lived investments, they must predict the structure of taxes five or ten years in the future. They need a clear idea of where the line will be drawn between public and private property, and where taxation and regulation will start and stop. Temporary taxes are bad, because they can be withdrawn or added to with equal probability. "Regime uncertainty" is bad because businesses lose confidence that they will be allowed to reap the benefits of their ventures. Our world is full of new opportunities, yet business investment is flatlining because of such uncertainties. The baleful role of "regime uncertainty" in prolonging the Great Depression in the United States under the New Deal has been documented by Robert V. Higgs in his article "Regime Uncertainty: Why the Great Depression Lasted So Long and Why Prosperity Resumed after the War," The Independent Review 1(4) (1997), pp. 561-590. From this point of view one thing that is wrong with our 50p tax rate is that it is temporary; it should not have been introduced in the first place, and our current indecision is making that worse. Another thing is what it stands for: a populist willingness to raid the rich on the pretext of collective guilt for past and future crimes.
Third, social justice is said to require tax cuts for the poor before the rich. I understand this argument but I find that it is faulty on several grounds. Richer households already pay far more than their share of income taxes. The one percent of taxpayers that pay the 50p tax rate contribute around one quarter of all income tax receipts. What is the principle of social justice that says this is not enough? Besides, the most important measures that will get low-income households out of poverty are job creation, welfare reform, and investments in the family life of children before school (because inequalities in educational outcomes are significantly formed before children ever get to school, and because higher rates of family breakdown contribute in distinct ways to both rising inequality and some children's stunted pre-school development; see The Hills Report: An Anatomy of Economic Inequality in the UK. Report of the National Equality Panel (John Hills, Chair; Mike Brewer; Stephen Jenkins; Ruth Lister; Ruth Lupton; Stephen Machin; Colin Mills; Tariq Modood; Teresa Rees; Sheila Riddell). London: The Government Equalities Office (2010)). Higher taxes on rich people are either irrelevant or harmful to these objectives.
Fourth, it has been said that the economy will benefit more from tax cuts for those on low incomes, because poor people will spend the money and the rich won't. As far as temporary tax changes are concerned there is little basis for this view in either economic theory or evidence. The best recent evidence comes from the United States where John Taylor has shown the complete lack of response of household consumption to the mailing out of millions of tax rebates in 2008 and 2009 and to the "cash for clunkers" programme. For a diagram that says it all, go to http://johnbtaylorsblog.blogspot.com/2010/10/cash-for-clunkers-in-macro-context.html.
Fifth, it has been said that the rich deserve punishment for bringing the current recession on us. I understand the sentiment but I reject it. It assumes that the only wealth is that gained at the expense of the community. This cannot be true in general: Britain is one of the richest countries in the world, despite our present troubles, because of 250 years of private enterprise, not because of government intervention or controls. I acknowledge that some people gained at the expense of others and this played a part in the financial crash that preceded and caused the recession. Some (not all) were bankers (and not all bankers were at fault in this). This is a serious issue. But the appropriate response is to punish those guilty under the law, and strengthen competition regulation and financial regulation, not to inflict arbitrary collective punishment on the entire class of people on whom we must rely to rescue our economy from its present plight. Besides, it is clear that politicians should share the blame for what went wrong. The credit crunch began in the housing market, which is already highly regulated in most western economies; politicians and regulators were deeply implicated in the overextension of subprime credit. The most convincing argument (measured by standards of evidence and logic) that I have found is that advanced by Raghuram Rajan in his book Fault Lines: How Hidden Fractures Still Threaten the World Economy (Princeton: Princeton University Press 2009).
Finally, it has been said that the signatories to the FT letter are self-interested, because they are surely all 50p tax payers. On this I speak only for myself. I am not even close, and I never will be. My only reason to oppose this tax is concern about the harm done to the community in which I live.
Mark Harrison
08 Sep 2011 22:28
| ![]() Tags: Economics Politics Recession
| Comments (0)
| Report a problem
Tags: Economics Politics Recession
| Comments (0)
| Report a problem
June 24, 2011
Russia's Crisis, Greece's Tragedy
Writing about web page http://www.ft.com/cms/s/0/4dfcca24-9e46-11e0-8e61-00144feabdc0.html
On the plane back from Moscow, I read Martin Gilman's No Precedent, No Plan: Inside Russia's 1998 Default (MIT Press, 2010). Gilman was the IMF's man on the spot during the Russian debt crisis of August 1998.
I flew into Moscow a few days after that crisis broke. Business life seemed to be paralysed. Many people that I met were panicked or in despair. But in retrospect, Gilman points out, this was the start of Russia's sustained recovery from the economic collapse that accompanied the breakup of the Soviet Union.
The crisis itself was very ugly. The disarray in Russia's public finances had built up over years, with persistent overspending, repeated failures to generate taxes, and the high inflation and high interest rates that resulted. In the private sector, Russian banks borrowed in dollars at low interest rates and bought up high-interest ruble bonds. In the crisis, the exchange rate plunged by a third, resulting in widespread bank insolvencies.
Gilman recounts the fear that Russia would turn away from a market economy and economic integration to ultra-nationalism and autarkic controls. In fact, there was no tragedy. At a lower exchange rate, the Russian economy regained international competitiveness and embarked on a decade of rapid growth that just about doubled real incomes.
As I read the story of Russia's crisis thirteen years ago, I was caught up in the parallels with Greece today. There are very important differences, of course. Greece is much smaller, with 11 million people to Russia's 140 million. Greeks are far richer on average, with $16,000 per head (at 1990 prices) compared with $5,000 per head for Russians in 1994. (And Greece doesn't have huge armed forces armed with nuclear weapons.) Surely, Greece's problems today should be more manageable than Russia's then.
In fact, Greece's crisis is similar to Russia's -- at best. When you add up all the political and financial claims on the economy, they exceed the resources available by an unsustainable margin. In Greece, people expected the public sector to guarantee jobs. They expected free services and benefits. They expected to retire early on fat pensions. They expected all this without paying taxes. The result was a growing debt, which had to be serviced. The government expected to be able to service the debt by borrowing more, so debt rose more rapidly. This was fine as long as interest rates were low, and as long as they could get away with misreporting what they were up to.
Now the only solution is to cut back on some or all claims on the economy. But whose, specifically? If Greece is not to default on the public debt at some point, there must be a huge fiscal adjustment. Back in February, the Financial Times put the tightening at somewhere between 8 and 22 percent of GDP -- and that was just to stabilize the debt, not reduce it. Greek living standards must fall by an unrealistically large amount. in fact, as Mervyn King reiterated today, Greece is insolvent. Default would at least allow Greece to transfer some pain to bondholders -- but domestic reform and retrenchment are still necessary, because who will lend to a defaulting government to cover its deficit?
In Greece now, as in Russia then, pain is inevitable but there is no prospect of agreement on how the pain should be distributed. Every group in the population -- the rich, the poor, the farmers, the business sector, the bankers, the public employees, the students, the pensioners -- looks for a way to pass the parcel onto others. The government does not have the authority to stop the game.
Moreover, much Greek debt is held abroad, so European bondholders, many of them French and German bankers, and increasingly the European Central Bank, are in the game too. The French and Germans are playing pass the parcel with the ECB; the British certainly don't want the parcel; as fast as the others pass it back to Greece, the Greeks hand it over again.
It is in everybody's interest to solve the Greek crisis quickly, but it is in nobody's interest to accept the role of victim. This must go on as long as at least one special interest inside or outside the country expects to gain by blocking a solution. Resistance will stop only when things are so bad that no one can any longer hope to derive a one-sided benefit from further delay.
In another respect, Greece's problem is worse than Russia's. The Russians could devalue. Devaluation of the ruble restored competitiveness and also cut incomes -- everyone's incomes -- by pushing up import prices. This put an end to argument over who should suffer the pain. Moreover, the pain was short-lived because recovery followed. Greece cannot copy this while it remains in the Euro zone. In fact, the only way of restoring Greek competitiveness is to wait while Greek wages and prices fall -- but this will not only take years; it would have the further highly unwanted side effect of further increasing the real burden of Greek debt.
Much good advice is being dispensed in the financial media about how to handle Greece's problems in an orderly, even optimal way. An orderly solution would mean several things at once: an agreed recheduling or restructuring of Greek obligations that decides how the pain is shared between Greece and external debtors; a fiscal programme that decides how the domestic adjustment is shared between taxes and spending, and between the various claimants on the Greek government; and a long term programme to liberalize Greek wages and prices and restore competitiveness.
There is nothing in the economic history of Russia or any other country to suggest that there can be an orderly solution for Greece. If an orderly solution was possible now, the problem would never have reached this point. Rather, it is more or less certain that the Greek crisis will break while everyone is unprepared, and it will work out in a chaotic, unplanned way, with unforeseeable consequences for Europe. For, without an exit from the Euro, the Greeks have no prospect of the rapid recovery that Russia made. An orderly exit from the Euro: what are the chances of that?
The Russian financial crisis came to a head in August 1998, unexpectedly, when many government officials, bankers, and IMF staffers were on vacation. As you pack your bags this summer, think about it.
P.S. I sincerely hope to be wrong.
Mark Harrison
24 Jun 2011 22:33
| ![]() Tags: Banking Economics Greece Recession
| Comments (0)
| Report a problem
Tags: Banking Economics Greece Recession
| Comments (0)
| Report a problem
April 26, 2011
The History of Britain's Public Debt Does Not Give Grounds for Complacency
Writing about web page http://www.johannhari.com/2011/03/29/the-biggest-lie-in-british-politics
Twice recently, the journalist Johann Hari has suggested that we are going through a manufactured crisis. The history of Britain's public debt, he argues, show that present levels are modest and there is no need for precipitate action to restrain government spending:
Here’s the lie. We are in a debt crisis. Our national debt is dangerously and historically high. We are being threatened by the international bond markets. The way out is to eradicate our deficit rapidly. Only that will restore “confidence”, and therefore economic growth. Every step of this program is false, and endangers you.
Let’s start with a fact that should be on billboards across the land. As a proportion of GDP, Britain’s national debt has been higher than it is now for 200 of the past 250 years.
The quote is from Johann Hari's blog, The biggest lie in British politics(March 29, 2011). Before that, in When will David Cameron's soufflé of spin collapse?(February 11, 2011) Hari wrote:
Beneath Cameron's entire agenda runs the biggest lie of all: that Britain is facing an "unprecedented" level of debt. In reality, Britain's national debt has been higher as a proportion of GDP for 200 of the past 250 years.
The full argument, widely blogged and tweeted, goes like this:
- Current debt levels are historically modest.
- So, there is no need for drastic action to contain the debt through deficit reduction.
- In fact, advocates of public spending reductions are creating a phoney sense of emergency in order to vandalize the welfare state for other reasons.
On a closer look, this line of reasoning raises interesting issues. Here is a chart that shows the evolution of Britain's public debt as a percent of national income since 1692:

(The figures from 1692 to 2010, and a forecast for 2011, compiled by Christopher Chantrill, can be found at http://www.ukpublicspending.co.uk/. I added the Office of Budget Responsibility forecasts for 2012 to 2014.)
First, is it true that Britain’s current debt level is historically modest? Yes, clearly -- although Hari exaggerates. As of 2011, Britain's debt ratio has been higher than it is now for just 169 (not 200) of the last 250 years (or you could say "200 of the last 282 years").
Next, is there anything else of interest in these figures? Well, since the level of debt today is the sum of past changes, we could also look at the rate of change of Britain’s public debt. Interestingly, there have been just 36 years in the last 320 when the debt grew faster as a percent of GDP than in 2009 to 2011. Let me give some twentieth century examples, and you'll get the idea. One run of years when the public debt climbed faster was 1915 to 1919. Another was 1941 to 1946.
In other words, Britain's debt has been growing in the last couple of years at rates generally exceeded only in major wars. It's particularly dangerous because, as I explained here, debt has persistence. Once the conditions have been created for it to grow rapidly, it'll go on rising under its own momentum until you take steps to control it. The longer you leave it, the harder it gets.
In some general sense, however, Hari has a point. It's true that Britain’s debt has been higher than it is now for more than two of the last three centuries. He overstates the case, which I dislike, but I accept that most policy advocates do that most of the time, and they can't all be wrong at once.
Now, some economic history. My point here is that there are important reasons why Britain today cannot handle the 200% plus debt ratios that characterized the 1820s (after the Wars of the Austrian and Spanish Successions, the Seven Years' War, and the Napoleonic Wars) and the 1950s (after World Wars I and II). If much higher debt levels were okay then, why not now? The answer begins with: because times have changed. We no longer live in the 1820s or the 1950s. It’s the twenty-first century.
How did Britain sustain that kind of debt in the past? Well, how do you handle a debt that is twice your income? The important thing is that you have to be able somehow to limit the interest payments. If debt is twice national income, as long as you can borrow at no more than 3%, you have to transfer only 6% of national income each year to bond holders. But, if the interest rate goes up to 12.5% (as it is today for Greece and Ireland) then the transfer eventually goes up to an infeasible 25% of national income. Basically, you’re insolvent.
How do you keep the interest rate down to 3%? In one of two ways. Either you dominate the world capital market – as Britain did in the eighteenth and nineteenth centuries. Or, you close the domestic capital market off from the world, so you can dominate your own little pool of saving – as Britain did in the mid-twentieth century. Either way, you can borrow if there's no one else for people to lend to.
In the eighteenth and nineteenth centuries, Britain could handle a much higher debt ratio than today’s because an integrated global capital market developed in which the British economy was the major borrower and lender. There was little credible competition with British bonds. As a result, British public debt remained universally acceptable despite its relative abundance. (The United States has enjoyed a similar position since World War II, but the uncontrolled U.S. budget deficit may eventually put an end to that.)
Before the twentieth century, moreover, the British government did not have major commitments to social spending at home. The spending of the central government was principally on administration and defence. As a use of government revenue, interest payments did not have to compete with major entitlement claims. This kept government guarantees of repayment credible.
The two world wars broke up the global capital market. Although no longer the world's financier, in the mid-twentieth century Britain could continue to handle a much higher debt ratio than today’s for a reason that was completely different from before. In a closed domestic capital market, British bonds were protected from competition. British lenders could not freely buy the bonds of other countries, even if they wanted to, because of government controls on foreign exchange and capital movements. With alternatives kept out of the market, British public debt continued to be acceptable at home.
Today, these conditions have gone. There is a global capital market again. British bonds have no specific advantage for foreign lenders (as they had in the eighteenth and nineteenth centuries), and domestic lenders can pick and choose among bonds issued by many countries (something they could not do in the middle of the twentieth century).
This is why a level of debt that was sustainable decades or centuries ago is not sustainable today. Today, no one has to lend to the British government for lack of alternatives. In short, whether or not it is true, it is irrelevant that "Britain’s national debt has been higher than it is now for 200 of the past 250 years." The conditions of those 200 years have gone.
Here is the first reason why it is important for the British government to control the level of public debt: the day of reckoning would be upon us if we didn't. A combination of rising debt, declining confidence, and rising interest rates would then force us to close the budget deficit even faster than planned at present. The world doesn't owe us a living; we already owe them. In fact, don't feel sorry for us; feel sorry for Americans that the U.S. Treasury has enough discretion to put off its day of reckoning until the fiscal mess there will be still more dire than it is now.
The world has changed; for Britain, has it changed for better or worse? Some people might think "for worse." There are those that don't like globalization on principle; others might wonder, more pragmatically, whether the conditions of the capital market half a century ago could be restored. Talk of capital controls is in the air again. If capital account liberalization made it more difficult for us to carry on with deficit spending and a rising public debt, then why not restore the protected capital market regime of the 1950s?
The case might be that, by restricting the choices of British lenders again, we could increase the domestic demand for British debt. (By the same token, however, we would also eliminate the foreign demand.) On closer inspection, this course of action hardly recommends itself. When lenders lose the will to lend, as with Greece, Ireland, and Portugal, it is usually for good reason. Taking away their option to buy elsewhere would amount to sticking fingers in our ears so as not to hear bad news.
Besides, if we restored the conditions that enabled the government to borrow more than twice GDP, what reason is there to suppose that the government would make better use of the money than private borrowers? Still one of the richest countries in the world, Britain’s prosperity has come from private enterprise and innovation, industrial and commercial revolution, and trade and finance; it did not come from Whitehall.
To finish up, the second reason for fixing Britain's debt while it is still at today's historically "modest" level is that having a debt twice your income is a sign that something went terribly wrong; a run of major wars, for example. Faced with the worst recession in 80 years, the British government was right to let its budget go into deficit temporarily. At that moment an increase in Britain's debt was inevitable. Now it's right to bring it back under control over a few years.
So, if the British government today cannot dominate its capital market and continue to eat up national resources beyond the willingness of the population to pay taxes -- there is reason to be glad.
Mark Harrison
26 Apr 2011 18:18
| ![]() Tags: Economics Keynes Recession Using-Data
| Comments (0)
| Report a problem
Tags: Economics Keynes Recession Using-Data
| Comments (0)
| Report a problem
April 24, 2011
Surely You're Joking, Mr Keynes?
Writing about web page http://www.debtonation.org/wp-content/uploads/2010/06/Fiscal-Consolidation1.pdf
The British government is seeking to bring the public debt under control by cutting back public spending. A popular story is going around, however, that suggests this is either crazy or a thinly disguised plot to undermine the public sector; see for example Johann Hari's blog, The biggest lie in British politics, March 29, 2011.
How does this story work? It runs like this. Start from the government’s plan for cutting public spending:
- With lower spending, the national income will fall.
- With lower national income, tax revenues will fall.
- With lower tax revenues, public borrowing will remain high.
- With public borrowing still high, the public debt will be hard to shrink.
- The burden of the debt relative to GDP could even rise.
In this story, the public debt is hard to control because it pushes back when the government tries to cut spending. It pushes back so hard that cutting public spending is actually counter-productive. In fact, the story implies that the government should spend its way out of debt! This is because more public spending would generate higher national income, higher tax revenues, less borrowing, and less debt relative to GDP.
How good is this story? It has a logic, purely Keynesian in spirit. But is it true? One issue could be that it leaves such factors as business confidence and the exchange rate out of the calculation. Ultimately, however, it’s an empirical question. That is, it can be answered by looking at how the public debt has actually responded to changes in public spending in the historical record.
It’s clear how both the UK Treasury and the independent Office of Budget Responsibility answer this question. They predict that, with the current fiscal squeeze, Britain’s public debt will rise more slowly, peak in 2014 at around 70 percent of GDP, and then start to fall. In other words, deficit reduction will eventually win. Given enough time, cutting public spending will not be counterproductive.
The Economic Consequences of Mr Osborne is a paper that Victoria Chick (of UCL) and Ann Pettifor (of the New Economics Foundation) circulated in June last year. It tells a more pessimistic story. It uses a century of data to suggest that the public debt varies negatively, not positively, with public spending. Fiscal cutbacks, they conclude, have consistently increased, not reduced, the burden of public debt. The key result is illustrated by their figure, below. The figure compares the change in the burden of the debt relative to GDP (the vertical axis) with the percent change in nominal public spending on goods and services (the horizontal axis), measured in annual averages over varying periods of time. The idea, I guess, is that nominal spending is the one thing over which the government has direct control; how does it affect the burden of the debt?
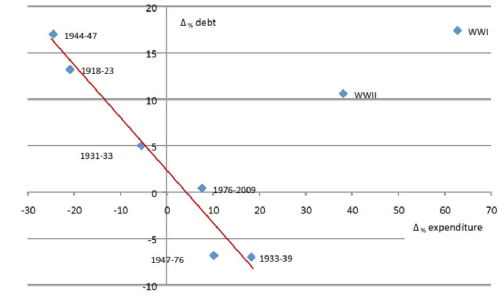
This chart suggests that a change in the public debt is negatively associated with a change in nominal public spending. When public spending falls, debt rises. Chick and Pettifor also report this result as a regression (the Δ symbol means “change in”):
Δ public debt/GDP = 2.2 – 0.6 x Δ public spending
Notes:
- The 2.2 means that the public debt would have risen on average by 2.2 percent of GDP per year in every episode if public spending remained unchanged.
- The 0.6 means that, in addition, debt tended to rise by 0.6 percent of GDP for each one percent cut in nominal public spending.
- Chick and Pettifor state that this relationship explains 98 percent of the total peacetime variation in the debt.
There are two implications. One is that deficit reduction is pointless because it will worsen the burden of the debt. The other is that the government can and should spend, not save its way out of debt.
This finding has been widely blogged and tweeted. It even made its way into a quarterly newsletter of the Royal Economic Society. But I have not seen any serious commentary so far. So, let me try. To begin, there are four odd things about the picture in the chart.
- The compression of 100 years of annual data into eight data points.
- The exclusion of the two data points that don’t fit (the two World Wars).
- The six data points that are used to fit the line are very different in coverage, ranging from two years (1931 to 1933) to 32 years (1976 to 2009).
- Regardless of the length of the period covered by each data point, the effect of public spending on debt is assumed to be exactly contemporaneous.
Is this a sufficient basis for a very important policy prescription? In my view, absolutely not.
Let’s look again at the data, which Chick and Pettifor helpfully provide in an appendix. Like them, I'll use nominal public spending changes to try to predict changes in the public debt burden. Unlike them, I’ll use all the data. I won't leave out any inconvenient observations. I’ll work on the basis that, if the relationship we are looking for exists, it ought to be simple and direct; it should not be instantaneous, but it should be speedy; and it should be there, year on year, in every period, regardless of other circumstances.
One other thing I'll do differently: Remember the 2.2 percentage points a year of upward drift in the debt burden that Chick and Pettifor found. Remember also the official forecasts that expect the Osborne budget cuts at first only to slow the growth of the public debt; not until 2014 will the debt start to fall relative to GDP. This reflects an important problem that Chick and Pettifor left out of account: the burden of debt has a momentum of its own.
What does this mean? Suppose there is a lot of public borrowing, causing the debt to rise rapidly. If the government reduces its deficit but does not eliminate it, the public debt will go on rising, but more slowly. It will not fall until the deficit is closed altogether. Moreover, while it is rising, the additional interest payments will be added to the debt, increasing it further. In other words, whether or not there is pushback in the public debt, there is certainly persistence. This is matched by the data, which suggest that public debt has moved systematically up or down over long periods under its own momentum. You can't ignore this if you want to understand how current fiscal policies affect the evolution of the debt.
My own calculation uses year-on-year changes in public spending (percent of previous year) and public debt (percent of GDP) from the Chick-Pettifor data. It allows the change in the public debt in a given year to be influenced by not one but two things, both in the previous year: how public spending was changing, and how the debt itself was changing. Including the latter means we can work out the historical persistence factor in the change in the debt from one year to next year. Using Δ to mean “change in” and “(-1) to mean “in the year before,” here are the numbers that come out:
Δ public debt/GDP = -0.01 + 0.74 x Δ public debt/GDP (-1) + 0.14 x Δ public spending (-1)
Notes:
- The 0.74 means there is quite a lot of persistence in the debt: if public spending was unchanging, but the public debt increased by one percent of GDP, it would increase again by 0.74 percent the following year.
- The 0.14 means that the historical relationship between a change in the public debt and the change in public spending one year previously is actually positive. This is the most important result. Allowing for the persistence factor, if the government increased nominal public spending by 1 percent, the public debt tended to rise by 0.14 percent of GDP the following year.
- The explanatory power in this relationship is quite high. For the experts, the t-ratios of the 0.74 and the 0.14 are 11.0 and 5.2 respectively, meaning that the probabilities of finding this pattern by accident are extremely low. Nearly 60 percent of the total historical variation of the change in the public debt is explained. Of course, this is much less than the 98 percent that Chick and Pettifor say their model explains. I set myself a far stiffer test, however, by using 98 (not 6) observations, so that there is much more variation in the data to be explained. I also included all the years that Chick and Pettifor arbitrarily dropped in order to get their result.
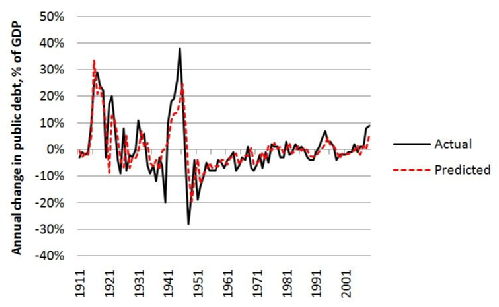
The next figure shows how well the regression equation predicts the actual year-on-year changes in the debt ratio over the whole period.
As a final check, I narrowed my focus down to those years in which nominal public spending actually fell. Public spending was unlikely to fall without a deliberate government policy of fiscal consolidation. Never mind what happened on average across the century as a whole; what happened to the public debt when the government took an axe to public spending? There were just ten such years within the sample. This is what happened in them.
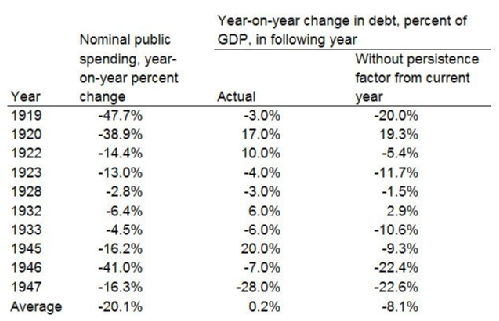
The first column shows that in these years nominal public spending was cut on average by 20 percent. The second column shows that in the next year the debt burden did not fall on average, and even rose slightly. Perhaps Chick and Pettifor would see this as validation of their idea. But it ignores the persistence factor in the debt. In most years that public spending was cut, there was already a large deficit that fuelled rapid growth of the debt. Unless the deficit was eliminated immediately, the debt would still grow, but at a slower rate. In the third column, I estimate how the debt would have behaved without the inherited momentum. On that basis, the debt would have fallen in eight of the ten years shown, and it would have fallen on average by 8 percent of GDP.
I'd never claim that this is the best that can be done. I do claim that, if you treat the same data properly, they can tell a very different story from the one that Chick and Pettifor come up with.
To sum up: Deficit reduction works. As for the Chick-Pettifor story, it is not completely wrong. There is a grain of truth in it. Once the public debt is set on a particular course, it is hard to change that course quickly. But it is just persistence that takes time to reverse; it is not a pushback so strong that trying to controll it becomes pointless or counterproductive. Once we allow for the momentum of the debt burden, we can uncover the simple, intuitive, positive relationship between spending and debt that even a non-economist might expect to find.
At the beginning I outlined a Keynesian story that starts with deficit reduction and ends with an increased burden of the debt. It is an intriguing story and it is popular among those that are easily satisfied when a result seems to match their preconceptions. But, like many intriguing stories, it is a fiction. What the figures actually show is that more public spending means more public debt.
Spend our way out of debt? Surely you’re joking, Mr Keynes.
Mark Harrison
24 Apr 2011 23:11
| ![]() Tags: Economics Keynes Recession Using-Data
| Comments (2)
| Report a problem
Tags: Economics Keynes Recession Using-Data
| Comments (2)
| Report a problem
January 09, 2011
Mine's a Litre: Are We Paying Too Much for the Road Lobby?
Writing about web page http://www.guardian.co.uk/business/2011/jan/09/fuel-prices-truckers-threaten-blockades
Yesterday a friend asked if I liked UK Petrol Blockade 2011. It turned out to be a cry for Something to Be Done:
Fuel has gone up too far now the tax is mad By the end of 2011 it will rise to over 1.50 a litre so remember the petrol blockade in 2000 Time for that again i say it will lose the Fuel companys money so the government will also lose money and look bad as the companys will add pressure on to the government so will have to do something about it it will take time but we need to do something now
I didn't take this too seriously until this morning, when I read in The Observer:
The spectre of trucks blockading streets in protest at record fuel prices – on top of student and public-sector worker demonstrations – will be raised tomorrow when the haulage industry unveils a campaign to force government to halt rises in petrol duty.
I thought hard about this. What was it all about? It seemed to be aimed at the government. Maybe the logic behind it was this:
- Fuel taxes are rising because the government needs more revenue just to pay for public services and welfare benefits that are currently funded from borrowing. Let's stop the government raising some of the taxes it needs, and force them to strip even more funding out of benefits, care homes, and so on.
No, it couldn't be that. Maybe the real target was the oil companies:
- Pension funds are already hurting because BP suspended dividend payments after the Gulf oil spill. Let's hit the pensioners even harder by disrupting oil company operations so that they face higher costs and lose more revenue and profits, and cut dividends further ...
No, it couldn't be that, either. Maybe it was simpler than I thought:
- Consumers are already hurting because of job losses and price and tax increases. Let's hurt them some more by blockading fuel supplies so that we can't move around, go to work, or buy stuff ...
Hmm. Somehow, I thought, we're getting further and further away from reality. This was my last throw:
- Food and oil prices are rising because the global economy's recovering from a dangerous recession. The recovery is increasing jobs, incomes, and the demand for commodities. As a result, oil prices have risen again. If the recovery is the problem, the solution's obvious. Let's stop the recovery and take the economy back into recession. If we can bring back the recession, oil prices can drop back down, making it cheaper for the people who lose their jobs a second time to drive the cars they won't be able to afford any more ...
I'm still struggling with that one.
The fact is that fuel should be taxed, for two reasons. First, fuel taxes are hard to avoid, so it's a good way to raise revenue. Second, burning fuel emits a lot of pollution and carbon dioxide, and the people that use it should pay society back for the damage they do to the environment we all have to share.
Is there any kind of case for giving the road haulage industry special treatment? A case that's been made involves unfair foreign competition.
Britishtruckers.com is arguing that UK firms are more at risk because of competition from abroad with foreign vehicles able to operate in Britain using cheaper fuel picked up on the continent.
It sounds compelling -- but think about it. There is less here than meets the eye.
Some truckers compete with foreign vehicles; others don't. The ones that face foreign competition are on the same routes as vehicles from overseas. That means they have exactly the same opportunities to pick up cheap fuel on the continent as their competitors. It's their choice if they fail to do so. No unfairness there.
In reality, the truckers that compete internationally are a situation no different from those that compete in the domestic market. If their fuel costs go up, they can either pass them on or not. If they can pass higher costs on to the customer, they're all right. If they can't, because their customers won't pay, there's a message in that -- like it or not.
It's not a case for special treatment.
On one point, I agree. In the UK, taxes on fuel are too high, relative to road charges. Fuel taxes should come down and, to compensate for this, congestion charges should be put in place in city centres and motorways. (And, of course, these charges will be paid the same by British and foreign truckers.) Why should this happen?
It is costly to provide roads, but in the UK nearly all road use is free. Because road usage is not priced, many of our roads are over-used. As a result, there is pressure to expand the road network, creating costs that would be avoided if road usage was not free of charge.
Other results of our lack of road charging include excessive wear and tear of roads (mainly by heavy trucks) and congestion (mainly by light passenger vehicles). Congestion wastes everyone's time and also increases fuel consumption because vehicles burn too much fuel while idling, creeping forward, and starting and stopping.
Some of the burden on motorists should be shifted from taxes on fuel consumption to charges for road usage. With less traffic on the most congested roads, we can save money on providing and maintaining them, and less time will be wasted in queues and jams. We could all end up better off.
There's only one problem: Campaigners for lower fuel taxes often turn out to be the most vehement opponents of road charging (not to mention speed limits, speed cameras, traffic lights, and other stuff). In other words, they're not interested in improving things for society. They just want to shift the costs of their own choices and activities onto other people.
Ironically, therefore, the road lobby itself is one of the biggest obstacles to moving towards a more efficient distribution of the tax burden -- including lower fuel taxes. Everyone's aware of the price we pay for petrol, but what about the price we pay for the road lobby? It may be higher than you think. Someone should do something about it.
Mark Harrison
09 Jan 2011 19:51
| ![]() Tags: Economics Politics Recession
| Comments (2)
| Report a problem
Tags: Economics Politics Recession
| Comments (2)
| Report a problem

 Loading…

