All entries for Sunday 24 April 2011
April 24, 2011
Surely You're Joking, Mr Keynes?
Writing about web page http://www.debtonation.org/wp-content/uploads/2010/06/Fiscal-Consolidation1.pdf
The British government is seeking to bring the public debt under control by cutting back public spending. A popular story is going around, however, that suggests this is either crazy or a thinly disguised plot to undermine the public sector; see for example Johann Hari's blog, The biggest lie in British politics, March 29, 2011.
How does this story work? It runs like this. Start from the government’s plan for cutting public spending:
- With lower spending, the national income will fall.
- With lower national income, tax revenues will fall.
- With lower tax revenues, public borrowing will remain high.
- With public borrowing still high, the public debt will be hard to shrink.
- The burden of the debt relative to GDP could even rise.
In this story, the public debt is hard to control because it pushes back when the government tries to cut spending. It pushes back so hard that cutting public spending is actually counter-productive. In fact, the story implies that the government should spend its way out of debt! This is because more public spending would generate higher national income, higher tax revenues, less borrowing, and less debt relative to GDP.
How good is this story? It has a logic, purely Keynesian in spirit. But is it true? One issue could be that it leaves such factors as business confidence and the exchange rate out of the calculation. Ultimately, however, it’s an empirical question. That is, it can be answered by looking at how the public debt has actually responded to changes in public spending in the historical record.
It’s clear how both the UK Treasury and the independent Office of Budget Responsibility answer this question. They predict that, with the current fiscal squeeze, Britain’s public debt will rise more slowly, peak in 2014 at around 70 percent of GDP, and then start to fall. In other words, deficit reduction will eventually win. Given enough time, cutting public spending will not be counterproductive.
The Economic Consequences of Mr Osborne is a paper that Victoria Chick (of UCL) and Ann Pettifor (of the New Economics Foundation) circulated in June last year. It tells a more pessimistic story. It uses a century of data to suggest that the public debt varies negatively, not positively, with public spending. Fiscal cutbacks, they conclude, have consistently increased, not reduced, the burden of public debt. The key result is illustrated by their figure, below. The figure compares the change in the burden of the debt relative to GDP (the vertical axis) with the percent change in nominal public spending on goods and services (the horizontal axis), measured in annual averages over varying periods of time. The idea, I guess, is that nominal spending is the one thing over which the government has direct control; how does it affect the burden of the debt?
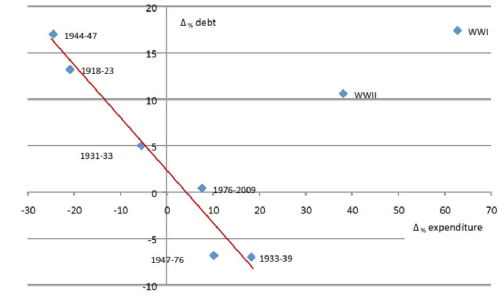
This chart suggests that a change in the public debt is negatively associated with a change in nominal public spending. When public spending falls, debt rises. Chick and Pettifor also report this result as a regression (the Δ symbol means “change in”):
Δ public debt/GDP = 2.2 – 0.6 x Δ public spending
Notes:
- The 2.2 means that the public debt would have risen on average by 2.2 percent of GDP per year in every episode if public spending remained unchanged.
- The 0.6 means that, in addition, debt tended to rise by 0.6 percent of GDP for each one percent cut in nominal public spending.
- Chick and Pettifor state that this relationship explains 98 percent of the total peacetime variation in the debt.
There are two implications. One is that deficit reduction is pointless because it will worsen the burden of the debt. The other is that the government can and should spend, not save its way out of debt.
This finding has been widely blogged and tweeted. It even made its way into a quarterly newsletter of the Royal Economic Society. But I have not seen any serious commentary so far. So, let me try. To begin, there are four odd things about the picture in the chart.
- The compression of 100 years of annual data into eight data points.
- The exclusion of the two data points that don’t fit (the two World Wars).
- The six data points that are used to fit the line are very different in coverage, ranging from two years (1931 to 1933) to 32 years (1976 to 2009).
- Regardless of the length of the period covered by each data point, the effect of public spending on debt is assumed to be exactly contemporaneous.
Is this a sufficient basis for a very important policy prescription? In my view, absolutely not.
Let’s look again at the data, which Chick and Pettifor helpfully provide in an appendix. Like them, I'll use nominal public spending changes to try to predict changes in the public debt burden. Unlike them, I’ll use all the data. I won't leave out any inconvenient observations. I’ll work on the basis that, if the relationship we are looking for exists, it ought to be simple and direct; it should not be instantaneous, but it should be speedy; and it should be there, year on year, in every period, regardless of other circumstances.
One other thing I'll do differently: Remember the 2.2 percentage points a year of upward drift in the debt burden that Chick and Pettifor found. Remember also the official forecasts that expect the Osborne budget cuts at first only to slow the growth of the public debt; not until 2014 will the debt start to fall relative to GDP. This reflects an important problem that Chick and Pettifor left out of account: the burden of debt has a momentum of its own.
What does this mean? Suppose there is a lot of public borrowing, causing the debt to rise rapidly. If the government reduces its deficit but does not eliminate it, the public debt will go on rising, but more slowly. It will not fall until the deficit is closed altogether. Moreover, while it is rising, the additional interest payments will be added to the debt, increasing it further. In other words, whether or not there is pushback in the public debt, there is certainly persistence. This is matched by the data, which suggest that public debt has moved systematically up or down over long periods under its own momentum. You can't ignore this if you want to understand how current fiscal policies affect the evolution of the debt.
My own calculation uses year-on-year changes in public spending (percent of previous year) and public debt (percent of GDP) from the Chick-Pettifor data. It allows the change in the public debt in a given year to be influenced by not one but two things, both in the previous year: how public spending was changing, and how the debt itself was changing. Including the latter means we can work out the historical persistence factor in the change in the debt from one year to next year. Using Δ to mean “change in” and “(-1) to mean “in the year before,” here are the numbers that come out:
Δ public debt/GDP = -0.01 + 0.74 x Δ public debt/GDP (-1) + 0.14 x Δ public spending (-1)
Notes:
- The 0.74 means there is quite a lot of persistence in the debt: if public spending was unchanging, but the public debt increased by one percent of GDP, it would increase again by 0.74 percent the following year.
- The 0.14 means that the historical relationship between a change in the public debt and the change in public spending one year previously is actually positive. This is the most important result. Allowing for the persistence factor, if the government increased nominal public spending by 1 percent, the public debt tended to rise by 0.14 percent of GDP the following year.
- The explanatory power in this relationship is quite high. For the experts, the t-ratios of the 0.74 and the 0.14 are 11.0 and 5.2 respectively, meaning that the probabilities of finding this pattern by accident are extremely low. Nearly 60 percent of the total historical variation of the change in the public debt is explained. Of course, this is much less than the 98 percent that Chick and Pettifor say their model explains. I set myself a far stiffer test, however, by using 98 (not 6) observations, so that there is much more variation in the data to be explained. I also included all the years that Chick and Pettifor arbitrarily dropped in order to get their result.
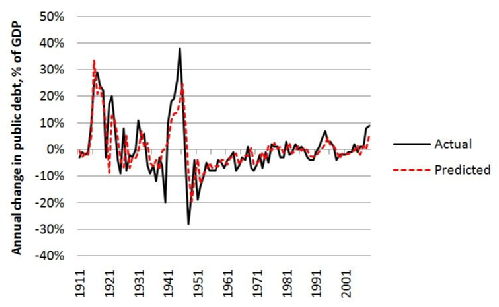
The next figure shows how well the regression equation predicts the actual year-on-year changes in the debt ratio over the whole period.
As a final check, I narrowed my focus down to those years in which nominal public spending actually fell. Public spending was unlikely to fall without a deliberate government policy of fiscal consolidation. Never mind what happened on average across the century as a whole; what happened to the public debt when the government took an axe to public spending? There were just ten such years within the sample. This is what happened in them.
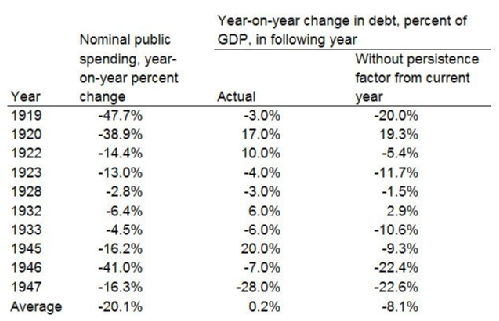
The first column shows that in these years nominal public spending was cut on average by 20 percent. The second column shows that in the next year the debt burden did not fall on average, and even rose slightly. Perhaps Chick and Pettifor would see this as validation of their idea. But it ignores the persistence factor in the debt. In most years that public spending was cut, there was already a large deficit that fuelled rapid growth of the debt. Unless the deficit was eliminated immediately, the debt would still grow, but at a slower rate. In the third column, I estimate how the debt would have behaved without the inherited momentum. On that basis, the debt would have fallen in eight of the ten years shown, and it would have fallen on average by 8 percent of GDP.
I'd never claim that this is the best that can be done. I do claim that, if you treat the same data properly, they can tell a very different story from the one that Chick and Pettifor come up with.
To sum up: Deficit reduction works. As for the Chick-Pettifor story, it is not completely wrong. There is a grain of truth in it. Once the public debt is set on a particular course, it is hard to change that course quickly. But it is just persistence that takes time to reverse; it is not a pushback so strong that trying to controll it becomes pointless or counterproductive. Once we allow for the momentum of the debt burden, we can uncover the simple, intuitive, positive relationship between spending and debt that even a non-economist might expect to find.
At the beginning I outlined a Keynesian story that starts with deficit reduction and ends with an increased burden of the debt. It is an intriguing story and it is popular among those that are easily satisfied when a result seems to match their preconceptions. But, like many intriguing stories, it is a fiction. What the figures actually show is that more public spending means more public debt.
Spend our way out of debt? Surely you’re joking, Mr Keynes.
 Mark Harrison
24 Apr 2011 23:11
|
Mark Harrison
24 Apr 2011 23:11
| ![]() Tags: Economics Keynes Recession Using-Data
|
Tags: Economics Keynes Recession Using-Data
|  Comments (2)
|
Comments (2)
|  Report a problem
 Please wait - comments are loading

 Loading…