All 14 entries tagged Provost
View all 16 entries tagged Provost on Warwick Blogs | View entries tagged Provost at Technorati | There are no images tagged Provost on this blog
April 12, 2021
Pay Gaps Revisited
The eagle-eyed amongst you might have spotted that the University recently published its annual pay gap report; if you haven’t seen this, it’s available here. I’m not going to repeat what the report says but what I do want to do is share a bit more data and insight.
First as context, pay gaps directly compare (for all grades) the hourly pay of staff across different sub groups. We are required to report pay gaps by gender but we have also chosen to report our ethnicity and disability pay gap. The Gender Pay Gap has changed little since our first report in 2017; the Ethnicity Pay Gap is showing signs of improvement while the Disability Pay Gap has deteriorated. For the first time this year, we have also calculated a Sexual Orientation Pay Gap (but we have not yet started to report this). I’ve summarised our figures in the table below. The percentages indicate the extent to which pay for men exceeds that for women, (and white staff v ethnic minority, not disabled v disabled and heterosexual v LGBT+).
|
31 March 2017 |
31 March 2018 |
31 March 2019 |
31 March 2020 |
|
|---|---|---|---|---|
|
Gender GAP |
||||
|
Mean gender pay gap in hourly pay |
26.5% |
26.0% |
25.9% |
26.8% |
|
Median gender pay gap in hourly pay |
23.4% |
25.3% |
24.7% |
23.3% |
|
Ethnicity |
||||
|
Mean ethnicity pay gap in hourly pay |
8.6% |
6.9% |
8.2% |
7.4% |
|
Median ethnicity pay gap in hourly pay |
7.2% |
5.1% |
4.2% |
5.7% |
|
Disability |
||||
|
Mean disability pay gap in hourly pay |
11.4% |
12.8% |
13.0% |
17.9% |
|
Median disability pay gap in hourly pay |
9.9% |
13.3% |
14.0% |
18.6% |
|
Sexual Orientation (LGBT+) |
||||
|
Mean LGBT+ pay gap in hourly pay |
- |
- |
- |
-2.7% |
|
Median LGBT+ pay gap in hourly pay |
- |
- |
- |
4.1% |
The University’s Pay Action Group has undertaken extensive analysis to understand more about the nature and causes of our pay gaps. It’s a complex picture – there are lots of factors that affect pay levels and progression. But we’re taking initiatives in a number of areas and I’ll say a bit more about this at the end of this blog.
If we look at gender pay initially and make some comparisons across grades, we see the following:
|
Mean Gender Pay Gap |
2018 |
2019 |
2020 |
% Female (2020) |
|---|---|---|---|---|
|
FA 1 |
-0.5% |
1.6% |
2.7% |
73% |
|
FA 2 |
-0.5% |
4.7% |
3.2% |
50% |
|
FA 3 |
0.9% |
2.1% |
2.7% |
73% |
|
FA 4 |
0.0% |
1.3% |
2.2% |
65% |
|
FA 5 |
1.1% |
2.1% |
2.9% |
57% |
|
FA 6 |
0.6% |
0.8% |
6.8% |
52% |
|
FA 7 |
0.8% |
2.1% |
2.1% |
49% |
|
FA 8 |
1.1% |
2.5% |
3.1% |
42% |
|
FA 9 |
5.6% |
8.2% |
12.4% |
26% |
|
CLINICAL |
10.3% |
26.1% |
28.1% |
40% |
|
Grand Total |
26.0% |
25.9% |
26.8% |
52% |
There are currently some marked gaps in Clinical roles, at FA9 and also at FA6; in other areas the gaps are much smaller. But the lower grades are dominated by women and the higher grades are dominated by men. This is sometimes described as vertical labour market segregation. Not surprisingly, if women are disproportionately in lower paid roles and men are disproportionately in higher paid roles, then small differences for individuals within will become a larger pay gap overall.
The table below looks at this in a different way and asks “what happens if we simply equalise salary with all grades (and for sub sets of grades)” – and the resulting pay gaps are in the first column. It also asks “what happens if we equalise the proportions of men and women across all grades” – and the results are in the second column”.
|
Pay Gap when salaries are equalised within grades |
Pay Gap when staff distributions are equalised within grades |
|
|---|---|---|
|
For all grades |
22.37% |
6.42% |
|
For bottom 3 grades |
26.01% |
21.35% |
|
For top 3 grades |
24.41% |
15.25% |
|
For top 3 & clinical grades |
23.75% |
14.55% |
|
For middle 3 grades |
21.87% |
24.95% |
What this tells us is that if we want to address the gender pay gap, we need to address the uneven distribution of staff by gender across different grades and we will have to do this at all levels – we can’t just focus on subsets.
The problem of vertical labour market segregation also plays a role in other pay gaps. For both disability and ethnicity, there is a similar challenge; disabled and ethnic minority staff are disproportionately represented in the lower grades.
|
BAME |
White |
Pay Gap |
% BAME |
|
|---|---|---|---|---|
|
FA 1 |
£8.75 |
£8.59 |
-1.81% |
26% |
|
FA 2 |
£9.45 |
£9.64 |
1.98% |
11% |
|
FA 3 |
£10.33 |
£10.61 |
2.69% |
15% |
|
FA 4 |
£12.15 |
£12.36 |
1.72% |
13% |
|
FA 5 |
£14.09 |
£13.96 |
-0.93% |
18% |
|
FA 6 |
£17.93 |
£18.42 |
2.64% |
26% |
|
FA 7 |
£23.39 |
£22.92 |
-2.05% |
17% |
|
FA 8 |
£28.46 |
£28.61 |
0.53% |
13% |
|
FA 9 |
£55.09 |
£50.59 |
-8.89% |
10% |
|
CLINICAL |
£59.56 |
£50.02 |
-19.07% |
25% |
|
Grand Total |
£19.45 |
£21.02 |
7.45% |
18% |
|
Disabled |
Not Disabled |
Pay Gap |
% Disabled |
|
|---|---|---|---|---|
|
FA 1 |
£8.67 |
£8.63 |
-0.49% |
6% |
|
FA 2 |
£9.66 |
£9.64 |
-0.20% |
10% |
|
FA 3 |
£10.45 |
£10.58 |
1.23% |
7% |
|
FA 4 |
£12.30 |
£12.34 |
0.32% |
6% |
|
FA 5 |
£14.93 |
£13.93 |
-7.19% |
6% |
|
FA 6 |
£17.15 |
£18.31 |
6.35% |
5% |
|
FA 7 |
£22.17 |
£23.04 |
3.75% |
4% |
|
FA 8 |
£28.01 |
£28.56 |
1.91% |
3% |
|
FA 9 |
£51.40 |
£51.36 |
-0.07% |
3% |
|
CLINICAL |
£27.30 |
£52.92 |
48.41% |
3% |
|
Grand Total |
£17.27 |
£21.04 |
17.90% |
5% |
When looking at the ethnicity pay gap we also need to consider sub-groups – and this year we have disaggregated the ethnicity data as shown below.
|
Black |
Asian |
Mixed |
Other |
|
|---|---|---|---|---|
|
Mean ethnicity pay gap in hourly pay |
27.8% |
2.7% |
12.1% |
10.0% |
|
Median ethnicity pay gap in hourly pay |
25.5% |
1.7% |
1.7% |
-3.0% |
|
Proportion of staff in when divided into 4 groups ordered from lowest to highest pay |
||||
|
Q1 |
4% |
11% |
2% |
1% |
|
Q2 |
2% |
13% |
2% |
1% |
|
Q3 |
1% |
14% |
2% |
2% |
|
Q4 |
1% |
10% |
1% |
1% |
This highlights that the relatively low overall ethnicity pay gap hides considerable variation across groups with the mean and median pay gap for staff from a Black background being significantly higher than that for other ethnic groups; again, its significant that staff from a black background are underrepresented at the higher grades within our staff base.
Having outlined to nature of the problem, let me say something about the work that is being done to address this – and this work is being scrutinised by Council, Remuneration Committee, UEB and is being overseen by Pay Action Group. We’ll soon be publishing our Pay Action Plan and that will give you more detail; the dominant focus is on addressing the problem of vertical labour market segregation – so trying to ensure we do as much as we can to get a more even representation of staff across all grades. And that means looking at how we do recruitment and how we need to improve that process to eliminate any possible biases (whether conscious or unconscious); it also means thinking about how we support and enable career progression, particularly for those groups who are underrepresented at more senior levels (training and development, job families and promotions processes). And of course we need to continue monitoring the nature of the pay gaps, the variations that exist across our diverse areas of activity and we need to be willing to make adjustments when we identify clear cases of inequity. And we need to encourage staff to continue to declare their status with respect to ethnicity, disability and sexual orientation. We can only analyse pay gaps when we have the data on individual protected characteristics.

Chris Ennew
Provost
Please click here for a PDF version of this blog: Pay Gaps Revisited
 Execblog Resource
12 Apr 2021 11:27
|
Execblog Resource
12 Apr 2021 11:27
| ![]() Tags: Provost
|
Tags: Provost
|  Comments (0)
|
Comments (0)
|  Report a problem
 Please wait - comments are loading
March 04, 2021
Doing More to Understand the Experience of Disabled Students
I’ve often thought that Universities do not always make the most of academic insights into the policy and management issues that we wrestle with. That’s not because we don’t value them, but rather because academic research often has greater visibility externally than it does internally. So I was particularly intrigued to hear about some of the work being done by a colleague in Warwick Business School looking at the employment experiences of disabled people. Partly as a result of this work, Kim Hoque was appointed to the Centre for Social Justice’s Disability Commission and the introductions and connections that he made, gave us the opportunity to understand more about the work that the Commission was doing.
The Commission is particularly concerned to understand issues relating to the education and employment of disabled people and our discussions with members of the Commission (and the evidence that we finally submitted) gave us the opportunity to reflect on the challenges that we face and the value of the initiatives that we have put in place. As recent studies have shown (see for example the Policy Connect Report – Arriving and Thriving), disabled students in higher education continue to experience disparities in continuation, attainment and graduate outcomes. Many disabled students still struggle to fully access teaching and learning in the way that they need. They often face greater administrative burdens than non-disabled students because they must request, organise and often fight for the support they need. And they may miss out on the full range of extra-curricular and social activities that are such a valued and valuable part of the University experience. If you ask our students, they will tell you that we still have a lot of work to do at Warwick to address these issues.
Our evidence to the CSJ’s Disability Commission focused specifically on the student experience; a particular theme was the importance of information and advice to facilitate successful transitions from school to University and from University to employment. At Warwick, we try to work with Schools, both to raise aspirations and to ensure there is an understanding of the type of support that is available - whether at Warwick or at university in general. We work with students and our careers (student opportunity) team to support with the transition to employment – working with organisations that encourage disability confident employers (e.g. MyPlus) and encouraging students to think positively about disability disclosure, marketing their skills that are related to living with a disability – resilience, adaptability and perseverance. Whilst many major employers now have good resources for disabled staff, supportive staff networks and a positive attitude, graduate employment outcomes for disabled students remain an area of concern.
While Warwick, like many other institutions, has a genuine commitment to supporting disabled students, it remains the case that both external and internal policies and practices create challenges that are not faced by non-disabled students. For example, the Disabled Students’ Allowance (DSA) provides support for costs related to studying that arise because of a disability of any type. It’s not means tested and has a value of up to £25,000 per year. But changes in 2016 to control costs mean that many decisions around provision are based more on the lowest quote than on the preferences of the student. We argued strongly in our submission to CSJ that there is a pressing need to look again at the operation of DSA to ensure it genuinely delivers to the needs of students. And it’s not just DSA that needs work – we need to look carefully at our own policy and practice to identify the ways in which we may, unintentionally, be creating unreasonable barriers that make it harder for disabled students to succeed. Unless and until we do, we will not be able to create the necessary climate that will enable our disabled students to realise their full potential.
Chris Ennew
Provost
Execblog Resource
04 Mar 2021 11:14
| ![]() Tags: Provost
| Comments (0)
| Report a problem
Tags: Provost
| Comments (0)
| Report a problem
November 19, 2020
Pay Gap
Gender Pay Gap reporting was mandated in 2017, and in the university sector this reporting has encouraged clearer acknowledgement of inequalities, and has raised many questions about their source. Last autumn, blog posts from the Provost, the Director of Social Inclusion, and the Co-Chair of the Race Equality Task Force introduced and discussed the institution’s latest pay gap data. In the subsequent Pay Gap Report 2019, Warwick extended the reporting to include pay gap data for ethnicity and disability. As Chair of the Gender Task Force, I welcome this opportunity to consider the intersections of these protected characteristics. Although we have incomplete datasets (as staff disclosure of protected characteristics is voluntary), there is still work we can do at institutional level to determine where improvements to policy and process may deliver the most scope to reduce inequalities.
At Warwick, the gender pay gap - the difference in hourly pay between the total population of women in the workforce and the total population of men in the workforce - is substantial. It is clear that the institutional pay gap is driven to a significant extent by demographic differences across the grades, with 68% of staff in the lowest pay quartile being female, and 64% of the staff in the highest pay quartile being male. If we were to ignore demographics, and simply consider rates of pay for women and men at the lowest grades, then the hourly rates are close to equivalence. It would be easy to overlook the upper middle quartile for pay, where there is almost no demographic difference by gender (49% female, and 51% male), but the data show that the average hourly rates for Grade 7 and above are higher for men than for women. Recognizing that there is a salary spine within each grade, are there demographic profile differences within these grades? What if recent efforts to encourage gender diversity have resulted in a scenario where there are plenty of women entering the career pipeline at Warwick, and we just need to wait until they have had an opportunity to progress through the grades? In 2018, 21% of Warwick’s professors were female; this rose to 23.4% in 2019. Is it just a matter of time until the pay gap is eroded? I don’t believe it is this simple, as the demographic differences are long-standing, and because snapshots of a population at a single point in time do not tell us about career trajectories, about the rates at which employees progress in the sector. These trajectories may have a critical story to tell.
Is gender a significant factor in career progression? If so, why? The catalyst for the Athena SWAN Charter, and the rationale for its original focus on women in STEM, was the observation that for early career academics in STEM disciplines, taking maternity leave led to an irrevocable setback in their research career. It was a cause for concern, as the sector was losing exceptionally talented individuals as a consequence. An academic researcher needs to be visibly established and respected for the quality of their work in order to sustain and progress their career. They will benefit from giving seminars at leading institutions and presenting work at high profile conferences, from using international facilities, building networks, working at a range of institutions, and establishing leadership of a research group. Until recently the majority of research funders have determined academic career stage (and thereby eligibility for many highly competitive grant schemes), by the number of months and years elapsed since an individual gained their doctoral status. Historically, the sector has tended towards quantifying academic success in terms of publication volume and grant income, and to looking for evidence of recent impact, leaving little or no space to take (or to account for) career breaks. The metrics-based culture has dis-incentivized part-time working, making it untenable for many until they approach retirement. In recent years, with a growth in understanding about how Diversity and Inclusion can improve organizational performance, it has become easier for staff to discuss these issues openly. It has made it possible to question systems that disproportionately exclude groups with protected characteristics, to challenge practices that reduce the talent pool available to an organization.
Against this backdrop, I welcome the recent substantial changes to the academic promotion process at Warwick. Studies within, and external to, Warwick have shown that women are more likely than men to postpone applying for promotion until they are sure of success, and there is also evidence that women are disproportionately likely to take on (and retain) time-consuming roles requiring a high level of collegiality [1]. The move to a points-based promotion system, enabling individuals to self-evaluate prior to making an application, the permission to apply in successive years, and the opportunity to put forward evidence and showcase positive impact from the full spectrum of roles undertaken by academic staff, has enabled high performing staff with more diverse portfolios to progress. Such revision of the processes fundamental to career development and progression are a key step in reducing the pay gap for the long term.
Now, in the midst of the COVID-19 pandemic, diversity issues that have scope to widen the pay gap have been accentuated. For example, surveys in the UK population identified significant disparities by gender for employment and caring responsibilities [2]. A study of impact in the wider community found that where women and men had equivalent jobs and shared parenting responsibilities, women in these households disproportionately absorbed childcare and home schooling responsibilities, continuing paid work for their employer, while more subject to frequent interruptions than men [3], resulting in extended working days and a highly fragmented working environment. Concerns surfacing in the academic community were highlighted by an article in May reporting a startling drop in research paper submissions from women, while there was a significant increase in submissions from men [4]. Warwick ran an institutional-level COVID Support Survey in July to obtain a quantitative and qualitative understanding of the challenges being faced by all staff, and to identify groups facing particular issues. Summary information from the survey was shared on Insite, and the findings are now being used by the central teams and by heads of department to better support staff as we go forward into an uncertain year.
Looking to the forthcoming academic promotion round in January 2021, we recognize that staff who intended to apply this year may be concerned that their case has been adversely impacted by exceptional challenges since the spring. We are therefore encouraging senior staff to volunteer as Promotion Advisors, to provide a point of contact for promotion candidates who will welcome additional support and guidance during the application process. This scheme has been developed over the summer; if you wish to be involved, please to contact the Provost Chris Ennew directly for further information. It is clear that many staff with protected characteristics have been particularly vulnerable to adversity arising from the COVID-19 situation, and the work we can do now to support colleagues will help mitigate the impact in our community.
Prof Jo Collingwood
Gender Task Force
23Sep20
References
[1] C. Guarino & V. Borden, Faculty Service Loads and Gender: Are Women Taking Care of the Academic Family? Res High Educ (2017) 58:672–694, DOI 10.1007/s11162-017-9454-2
[2] Fawcett Society Briefing, Parenting and Covid-19 – Research evidence, August 2020 https://www.fawcettsociety.org.uk/parenting-and-covid-19
[3] A. Andrew et. al. How are mothers and fathers balancing work and family under lockdown?’ IFS Briefing Note BN290, 2020, https://www.ifs.org.uk/publications/14860
[4] A. Fazackerley, Women's research plummets during lockdown - but articles from men increase, The Guardian, 12th May 2020 https://www.theguardian.com/education/2020/may/12/womens-research-plummets-during-lockdown-but-articles-from-men-increase
Execblog Resource
19 Nov 2020 12:12
| ![]() Tags: Provost
| Comments (0)
| Report a problem
Tags: Provost
| Comments (0)
| Report a problem
April 23, 2020
Pay Gaps and the Merit Pay and SPRR Processes
Towards the end of last year, the University’s Pay Action Group (PAG) published a series of blogs that examined our pay gaps in relation to gender, ethnicity and disability. Those discussions highlighted some genuine concerns about our current position as well as the challenges of trying to bring about real and long lasting change. We are working to explore a range of changes to policy and practice in order to understand how the University can address its pay gaps. For example, we have supported and encouraged new training and development initiatives, we have identified a number of changes to the University Recruitment policy and we are working on approaches to encourage more individuals to self-declare in relation to ethnicity and disability to ensure that our measurement is more accurate.
Understanding what our data tells us is an important part of the work of PAG; having looked at pay gaps in earlier blogs, we have been keen to consider other aspects of how individuals are rewarded. Most recently we have been looking at some of the outcomes of the Merit Pay process and Senior Pay and Remuneration Review (SPRR) to see if we can get a better understanding of how these processes work in relation to certain protected characteristics. These are both annual processes that reward individuals based on a judgement about their performance during the previous year. Merit pay applies to colleagues in grades FA1 to FA8 and SPRR applies to colleagues at FA9.
The Outcomes of SPRR
The table below shows participation in SPRR by gender since the 2016/17 review period. Participation in SPRR is voluntary and is an individual (rather than a manager’s) decision. The data show that while there is a markedly larger eligible male population, participation rates have been (on average) a little higher for female staff.
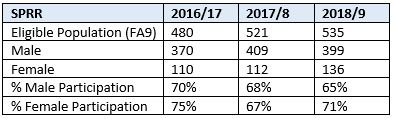
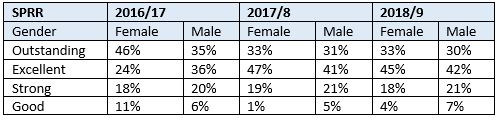
The distribution of performance ratings by outcome and gender is shown below. The distribution by outcome is broadly similar for male and female staff, although in the last two years, a slightly larger proportion of female participants have received the higher ratings.
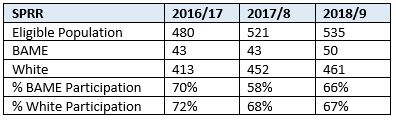
The next two tables consider participation and grading on the basis of ethnicity. We use an aggregate grouping – BAME – because the relatively small numbers at FA9 make further disaggregation difficult. Currently, the BAME group is 9% of the Level 9 population – 50 staff in total. Apart from 2017/8, the differences between the two groups are small, but looking over the entire period the level of participation in SPRR by BAME staff looks to be a little lower than for white staff.
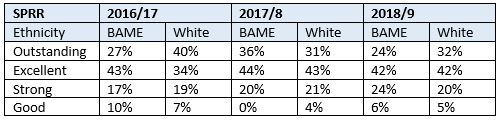
There is quite a bit of variability in the distribution of outcomes by ethnicity and, of course, the small BAME community at FA9 means that a change in the position of one or two individuals can have quite a big impact. Having said that it is noticeable that a rather smaller percentage of BAME staff were graded as excellent or outstanding in 2018-19 when compared with white staff.
Merit Pay Outcomes
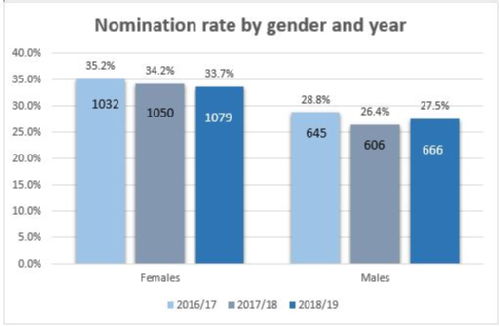
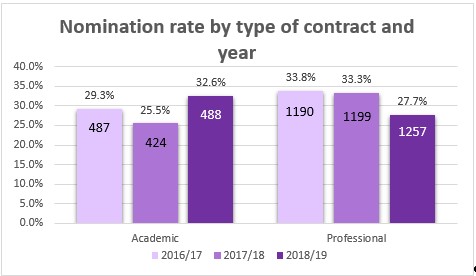
The merit pay population is much larger than the SPRR population, covering all staff in grades 1-8. While there is some variability in nomination rates across grade and across area, on average, around 30% of staff are nominated for Merit Pay awards. Moderation processes are used to challenge nominations with a view to ensuring that there is fairness across the community.
Looking at merit pay nominations by gender, the graph below shows that this year 33.7% of eligible women were nominated compared 27.5% of eligible men. The female nomination rate has gradually decreased whereas the male nomination rate has increased slightly since 2017/18.
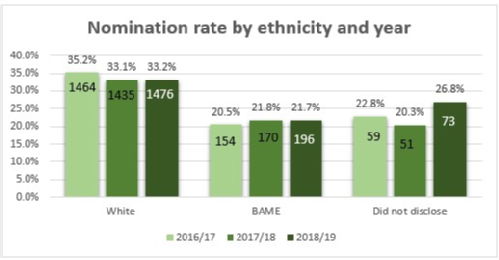
The next graph shows that the percentage nomination rates for those of white ethnicity has decreased since 2016/17. BAME nominations have marginally increased since 2016/17. The nomination rate for those who have not previously disclosed their ethnicity has increased significantly since 2017/18.
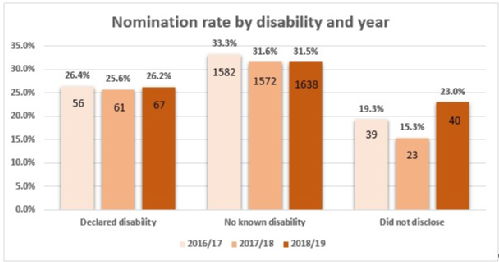
Moving on to disability, nominations for staff who declared that they have no known disability have slightly decreased over the years whilst the nominations for those with a declared disability are essentially unchanged. For those who did not disclose, the nomination rate has increased significantly (7.7%).
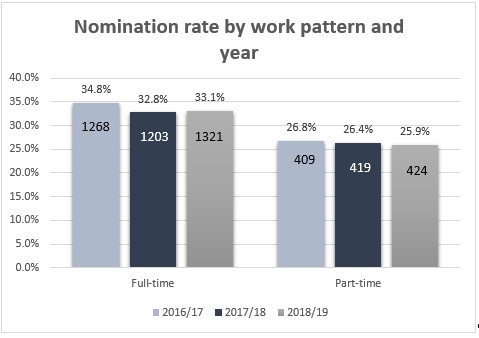
The change over time in the nomination rate for part-time and full-time is marginal, however it is worth noting a significant difference (around 7%) in nomination rates between these two groups of staff.
Finally, looking at staff group, the graph below shows that nominations for academic staff have increased for the 2018/19 review period whereas the nominations for professional staff has decreased by 5.6%. For the current year, there is a difference in the nomination rate of 4.9% between Academic and Professional Services Staff.
So, what can we learn from these numbers? Well for SPRR there is more variability in outcome by ethnicity than there is by gender – and numbers for disability are too small to allow any analysis to be undertaken. For gender, the simple male/female comparison suggests few differences but for ethnicity the recent outcomes look to be more favourable for white staff.
When we consider merit pay there are more marked variations in relation to protected characteristics and these need to be looked at more closely. And we will be reviewing the operation of the merit pay arrangements following this analysis and based on feedback from a number of different groups within the University.
There are still significant numbers of staff who do not declare their ethnicity and/or disability; without knowing the characteristics of the non-declaring staff we can’t be sure how reliable our analysis. Accordingly we will be exploring options for encouraging more staff to declare to ensure that we get the best possible understanding of our position and identify the changes that we might need to make.
Finally, it’s worth noting that what this analysis doesn’t do is consider issues of intersectionality – it looks only at single characteristics by themselves and future analysis will need to dig deeper to consider, for example, links between gender and ethnicity or links between work pattern and disability.
Chris Ennew
Provost
Execblog Resource
23 Apr 2020 10:47
| ![]() Tags: Provost
| Comments (0)
| Report a problem
Tags: Provost
| Comments (0)
| Report a problem
March 03, 2020
Green Week: Thinking about our Climate Emergency
Green Week is our annual celebration of the environment, and a time when we work with partners in the region to promote some of the great activities that are happening to help us all to be more sustainable, in our day-to-day lives. It’s also an opportunity for us to focus on the future courses of action that we need to take as individuals, as communities, and as organisations. Indeed in the period since we declared our Climate Emergency we’ve seen the emergence of a number of important initiatives which include de-carbonising our electricity usage and increasing re-use and recycling through initiatives within Campus and Commercial Services.
There is a huge range of activities to take part in over the course of Green Week – from ‘swap shops’ where you can exchange clothes for new ones, to a Green Fair at the end of the week. There really is something for everyone, so make sure to get involved and book onto events happening across our campus this week.
With all this activity on campus around all things sustainable, there couldn’t be a better time to start talking with you about some changes to our travel policy and to our investment policy. Both of these changes have been encouraged by the Climate Emergency Task Force which met for the first time in January. Its role is to provide advice and facilitate better co-ordination of the University’s actions to address a climate emergency, and business travel was one of the first things it considered. Whilst we are still working out specific details, I’d like to give you a feel for what’s coming up.
Upcoming changes to our Travel Policy
We are moving to a situation in which the normal expectation would be that train is used for journeys that are within Great Britain or are around six hours. This would encompass destinations such as Paris and Brussels, as well as Edinburgh, Glasgow and Aberdeen.
We also plan to introduce our own internal offset mechanism for flights. To enable us to do this quickly, we will be introducing a simple system. There will be two levels – one for flights within Europe and one for flights beyond. An internal charging mechanism will be put in place and the funds collected will be used to support on-campus initiatives to reduce our carbon footprint. The aim would be to implement this at the start of May (the beginning of Q3 of the financial year), but in terms of train travel, the new arrangements can start straight away for new bookings. You’ll be hearing more about this soon.
Upcoming improvements to Socially Responsible Investment
We are looking to move to a more proactive approach to the management of our investments so we more actively target our investments in the Environmental, Social and Governance (ESG) arena where companies are seeking to have a more positive impact on the environment, and where there is a commitment to more socially responsible practices. The Investment Sub Committee keeps the University’s Socially Responsible Investment policy under review, and is in the process of finalising the new approach and agreeing the details.
This all represents a good start to fulfilling our Climate Emergency Pledge, but there is a great deal more to do. I greatly look forward to working with our community to fulfil our responsibilities to help combat climate change through our individual actions, our research and teaching, and how we run and develop our university.
Chris Ennew
Provost
Execblog Resource
03 Mar 2020 10:42
| ![]() Tags: Provost
| Comments (5)
| Report a problem
Tags: Provost
| Comments (5)
| Report a problem
November 28, 2019
Playing our role in combating climate change
We have known about climate change for decades, we’ve talked about it for decades but there is now a very real pressure on all of us to act. And a very clear message that it is the next decade that will be crucial if we are to stem the global rise in temperature. Back in September 2019, the University of Warwick joined other universities and organisations locally, nationally and globally in declaring a Climate Emergency, and highlighting the role we must play as an organisation, as a community and as individuals.
We’ve committed to zero net carbon from direct emissions and from the energy that we buy by 2030. We’ve also committed to zero net carbon from our direct and indirect emissions by 2050. Our new buildings are low energy and more space efficient and we recycled building materials where possible. And while it may not be very visible, we have already reduced our carbon emissions from energy usage by 33% per staff and students FTE, and by 40% by unit of floor area since 2005/6. We have also reduced water consumption by 27% per staff and students FTE over the same period. But we’ve also grown over that period and so the impact on overall energy and water consumption is less dramatic. As we look to 2030 our challenge is to reduce our carbon footprint while still enabling planned growth.
We are delighted to see so many staff and students changing behaviour and processes to support the University in reducing our carbon emissions, but there is much more we need to do. The next national Global Climate Strike is scheduled for Friday (29 November), and for members of our community that are motivated to get involved with others from around the world to combat climate change, there is much that you can get involved in.
We are taking part in an amazing new national recycling competition called Recycle League, competing against 11 different UK Universities to see which of us can improve our recycling rates the most during November. We’re reducing food waste through TooGoodToGo and trialling BorrowMyCup with the SU to reduce the waste from disposable cups.
Our ‘Cut the Flow’ ambassadors are running a photo competition on Instagram to raise awareness of water and energy consumption. You can take part by uploading an image or creative poster that illustrates your efforts to save water or energy (or, indeed, both!) using #CutTheFlow2019 and if you win, you’ll get £20 on your Eating at Warwick card.
And on Thursday 28 November 2019, staff and students from across the University that have a passion for sustainability are coming together at a sustainability Summit event. Joel Cardinal, Head of Energy and Sustainability at the University, will be joined by other groups at Warwick to explore different strategies – technical, organisational and behavioural – to underpin the carbon targets for 2030 and 2050.
I also want to take this opportunity to thank and congratulate the volunteers that collected eight tonnes of food surplus from halls of residence as students moved out, and donated it to local food banks. The group also collected other leftover items and held a ‘pay as you feel’ sale at the start of term, which raised a fantastic £3,596 which was donated to a local environmental charity.
In addition to these student and staff led initiatives, we also have a responsibility in combating climate change through our research and teaching, and how we run and develop our university. We continue to work with partners and colleagues outside the university to embed ambitious innovative sustainable development into our region, utilising more efficient fuels, transport and energy generation methods.
Just this week, WMG welcomed industry speakers and academics to campus to attend the Very Light Rail Conference. Very Light Rail is a lower cost, zero emission option for sustainable transport, that we believe could create modal shift and encourage people to leave their cars at home.
And in September we launched our Institute for Global Sustainable Development; Warwick’s hub for transdisciplinary research on global sustainable development that will enable transformative change in global sustainable development. This Institute sits with our Global Sustainable Development degree programmes which offer a multidisciplinary curriculum that addresses sustainability in its broadest sense.
Sustainability is vitally important to the University, and that there is a lot of work under way to progress us towards the commitments we have made. But so much more is needed if we are going to meet the challenge we have set ourselves. Some actions may be easy and obvious (though not necessarily cheap) – buying green energy, reducing the use of cars, increasing use of public transport. Some interventions will be more of a challenge – changing consumption patterns or reducing the amount of space we use. And while it may sound clichéd it will be something that requires a commitment and a willingness to change from all of us.
Thanks

Chris Ennew
Provost
Execblog Resource
28 Nov 2019 18:22
| ![]() Tags: Provost
| Comments (1)
| Report a problem
Tags: Provost
| Comments (1)
| Report a problem
October 15, 2018
It's all about the experience…
Although we’re just finishing welcoming new students, and welcoming back our existing ones, the recruitment cycle for next year is already in progress. I’m looking forward to the forthcoming open day, although my role there is a small one – I give part of the welcome address to prospective students and their parents. These are important events; the numbers attending open days are going up, and we know that the open day experience makes a real difference to student choices.
Although students (and their families) are concerned about the outcomes of university education (and there are lots of ways in which we can measure these), they also know that the experience matters and indeed the quality of the experience will make a difference to the quality of the outcomes. And because experience matters, open days matter because they give insight into what it’s like to be a student at Warwick.
Of course, if we want to demonstrate the Warwick experience to prospective students, we have first, to persuade them to come to our open days. And that’s where marketing and recruitment activities come in. For this current recruitment round there has been a major redevelopment of our prospectus and other associated marketing materials with a focus on how best to talk about both student experiences and outcomes. We know that some of the hard metrics such as league tables, and graduate salaries will be part of student decision making and this information is widely available. So in our communications, we’ve focused much more on the experience side, using a story-telling approach.
Given that my own academic background is in marketing, I’m always interested to see how our marketing and communications activity develops. And for some time in marketing (particularly in the service sector) the focus of marketing has shifted from promoting the attributes of a product or service to concentrating instead on experiences. So it makes perfect sense that we should be working in a similar way.
If you look at the prospectus or at the website, you’ll see marketing communications that tell stories – stories about what it’s like to be a student and what our students will take away from their Warwick experience. These stories may be partly founded on our reputation, but they’re also about our people, our thinking and the place in which we’re based. We try to emphasise the positive outcomes that students are looking for - that their study at Warwick will enhance their wellbeing and their future, that it will offer better career opportunities, and that it will open up a wealth of possibilities.
It is an approach that looks to be making a difference; we’ve seen record attendances at our most recent open days, and despite the declining number of 18 year-olds, our UG applications have remained strong. Of course, this encouraging picture is the result of a number of factors. For example, the Student Recruitment, Outreach and Admissions Service (SROAS) has been hugely effective in advancing its student recruitment approach and in managing the open day experience.
Also notable is the increased collaboration between SROAS and our marketing teams. This has meant promotional materials used by our recruitment leads are both practical and persuasive…and storytelling is vital to making our marketing collateral compelling.
No one can know, in advance, what their experience will be like. But the combination of storytelling and open day activities gives prospective students a real insight in to what their University experience at Warwick might mean. That’s why open days are so important and that’s why we’re grateful to everyone who has helped to make them such a success.
Cheers

Christine Ennew, Provost
Execblog Resource
15 Oct 2018 12:25
| ![]() Tags: Provost
| Comments (0)
| Report a problem
Tags: Provost
| Comments (0)
| Report a problem
October 08, 2018
What we need to learn about the campus experience of all our disabled staff, students & visitors….
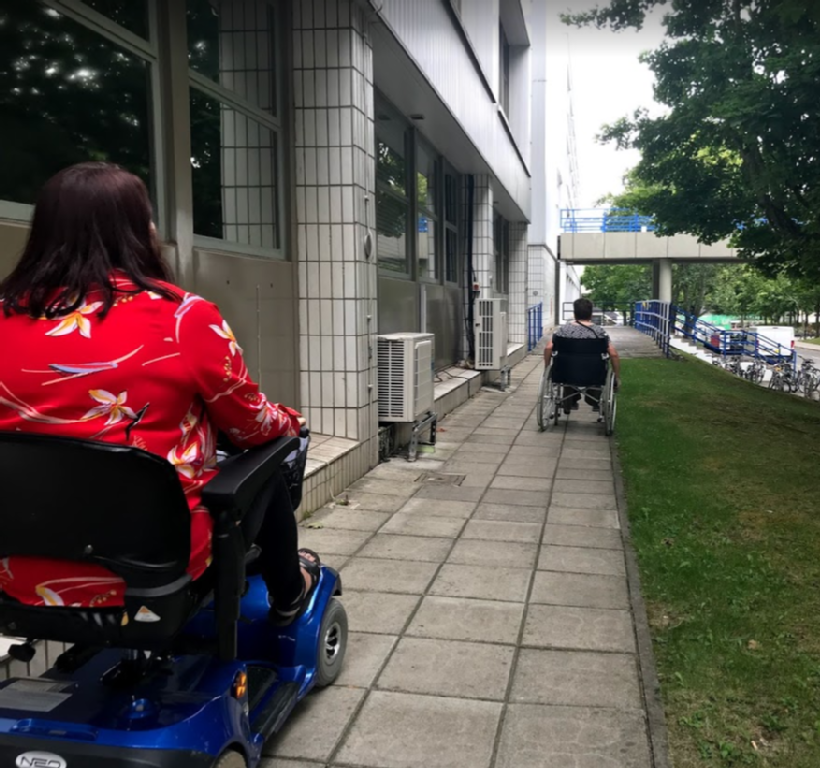
Earlier this year, Warwick signed up to be a member of the Business Disability Forum (BDF). BDF provides members with practical support by sharing expertise and providing training and networking opportunities which help our work with disabled staff, students and visitors. We’ve also established a Disability Standards Steering Group (which I chair) and this brings together key stakeholders from across campus to determine how we might best work towards meeting BDF’s Disability Standards.
One challenge that we face is that it is often difficult for someone who is not disabled to understand how what we see as commonplace can create challenges for others. So, earlier this year one of our Steering Group members, Jenny Wheeler, worked with the Equality, Diversity and Inclusion team to run the ‘Wheelchair Challenge’, which required participants to navigate around campus in a wheelchair (and then feed back on their experience). I couldn’t participate at the time so Jenny agreed to run the challenge again in August for myself and Jane Openshaw from Estates, to help us to understand what it’s like to be a wheelchair user on campus.
We started off with one electric scooter and one manual wheelchair, with Jenny as our trusty guide and supervisor.
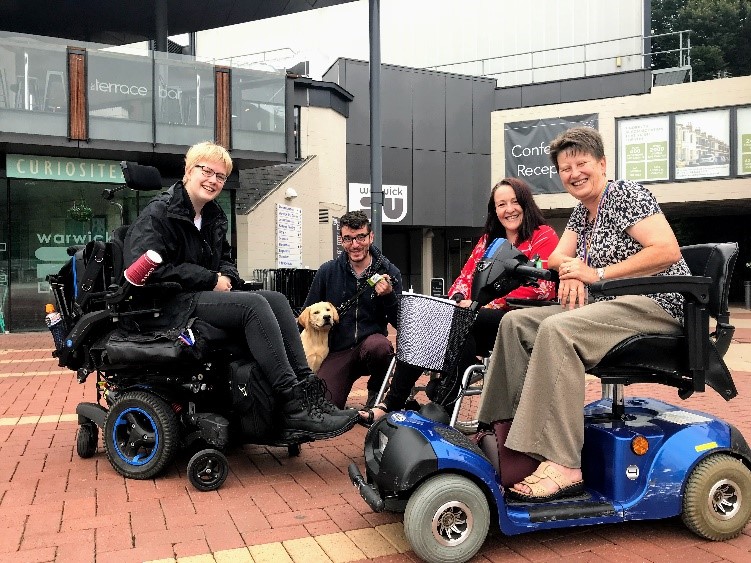
Our friendly trainee guide dog comes to see us off on the challenge.
It will probably sound clichéd, but this was a real eye-opener for me. I was lucky and started the challenge with the electric scooter, leaving Jane to get herself up the slope from Rootes in the manual wheelchair. I then transferred to the manual chair for a brief comfort break at the Oculus before heading to the Sports Centre, from where we tried to find our way into the Chemistry Building. Then it was back to the library before negotiating our way back to Rootes.
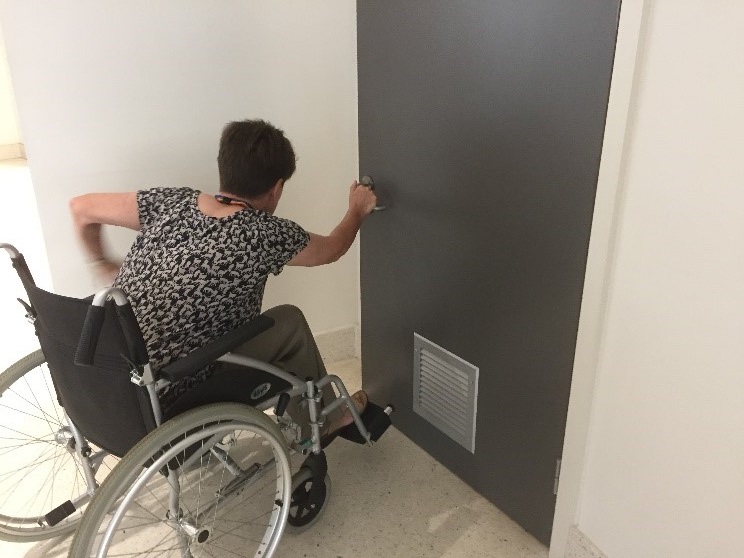
Hmm – going to the loo isn’t going to be as easy as I thought.
Getting into a disabled toilet is far more difficult than it looks and the camber on pathways can make steering and controlling a wheelchair an interesting experience. And even the slightest lip on a drop kerb can make a manual wheelchair user feel quite vulnerable. The biggest positives for me were people who were sensitive to the need to give you space and who were willing to offer a helping hand. The contractors working in campus at the time were great with regular offers of a helping hand (although Jenny did enjoy telling them that we had to do it ourselves!).
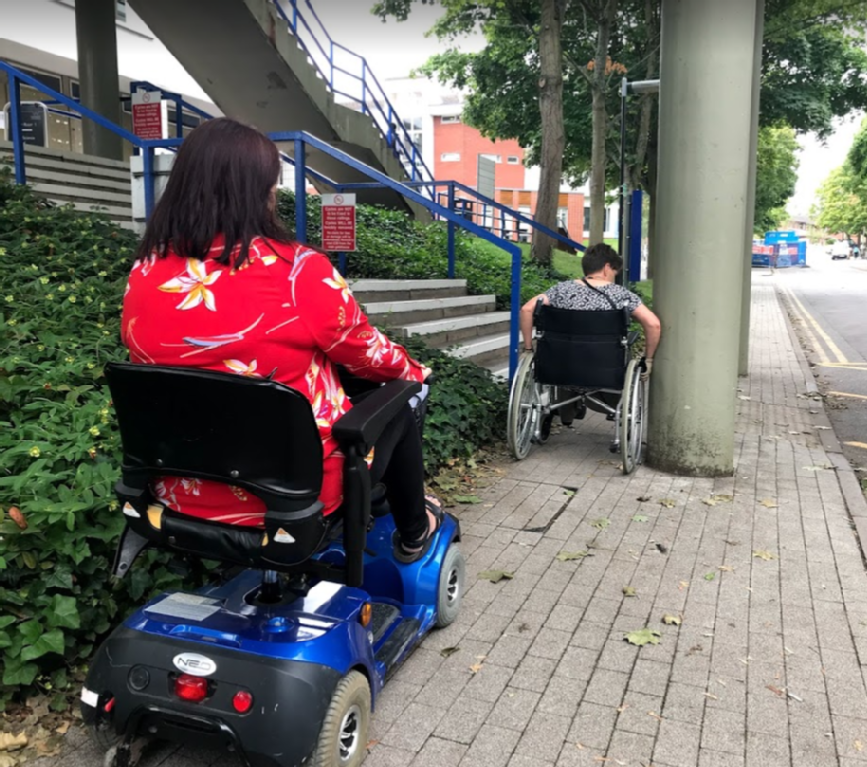
Not sure I’m actually going to make it through here.
The routes between buildings weren’t always obvious to a novice, but mostly we managed to work it out (although it often required quite a bit of creative problem solving on our part). Having said that, I’m not sure I actually managed to work out how to deal with my own need for a regular coffee fix. A steaming hot Americano and a manual wheelchair are not a good combination and Jenny’s top tip – never, ever try to hold your coffee cup between your thighs – was probably one of the best bits of advice of the day!
So this is how you get into Chemistry!
As I walked back to University House, I had time to reflect on the impact of both the physical environment and human behaviour on the ability of many disabled people to navigate campus. My immediate learning points related to the challenges associated with some design features in the physical environment and how other campus users might help (or not) someone with mobility issues. The experiences and challenges for those who may, for example, be blind or deaf will be very different but also probably not well understood by many of us. We still have much to learn about how we can improve the campus experience for all our disabled staff, students and visitors.
Cheers
Christine Ennew
Provost
Execblog Resource
08 Oct 2018 14:06
| ![]() Tags: Provost
| Comments (0)
| Report a problem
Tags: Provost
| Comments (0)
| Report a problem
March 29, 2018
Measuring the gap – update
The full report on gender pay gap at Warwick can be read here.
The first blog that I wrote on joining Warwick was about the gender pay gap and as we prepare to make our first statutory gender pay report as required under the provision of the 2010 Equality Act, it seemed a good time to return to this issue. And of course, having been here for 18 months, I’ve now got a much clearer idea of how our processes work and what’s being done to address this and other related issues.
Gender Pay
The new reporting requirements on gender pay mean that we provide high level information on pay levels and distribution for female and male staff – and across the UK, employers have started providing this information with the deadline for submission towards the end of March. And of course the broader issue of gender pay differentials has attracted considerable interest in recent months. We’re probably all familiar with the furore over gender inequalities in pay at the BBC while data from other companies has highlighted some equally dramatic differences in pay between men and women. Organisations as diverse as the Bank of England, Shell, Ladbrokes Coral and the Department of Health are reporting differences in average hourly pay that are comfortably into double digits while some airlines have reported one of the differentials as high as over 50% largely because of the relatively high salaries earned by pilots who are dominantly male.
The airlines example highlights one of the challenges associated with a reliance on headline figures across the workforce. The factors behind gender pay gaps are hugely complex which makes it hard to look at this issue from a generalist perspective. The University’s own figures point to a significant gap in average hourly pay between men and women overall.
Equal Pay
In trying to understand the source of differentials, a quick look at pay differences by grade shows that at levels 1 to 8, there is virtually no difference. As can be seen below, only at level 9 is there evidence that men are paid significantly more than women.
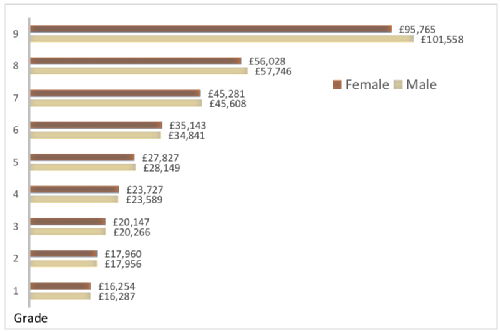
Grade 9 covers Professors and very senior professional staff. The differential here is marked but has fallen in recent years, in part because of a rigorous programme of equality adjustment each year as part of the review of senior salaries.
The problem that faces the University of Warwick – and indeed many other organisations – is not so much a failure to pay equally to staff at the same level, but rather a skew in the gender distribution across levels, with more women in lower paid occupations and more men in higher paid occupations. And until this changes, we can continue to pay equally for staff at the same level, but a gender pay gap will persist.
So, for us and for many other organisations, the imperative has to be around raising aspirations and creating opportunities for women to advance their careers. But there are few quick fixes. Some organisations outsource many of the activities that are dominantly female and lower paid. Their figures may look better but it doesn’t solve the problem. At Warwick, we prefer not to outsource. Some advocate quotas and positive discrimination – a more controversial approach and one that most organisations in the UK have steered clear of. Instead, our focus of attention continues to be on training and development, on the identification of structural barriers to progression and on tackling the widespread, implicit biases that inhibit the career development of women across all grades. It won’t produce quick change, but it will produce sustained change.
Christine Ennew, Provost
The full report on gender pay gap at Warwick can be read here.
Execblog Resource
29 Mar 2018 10:28
| ![]() Tags: Provost
| Comments (16)
| Report a problem
Tags: Provost
| Comments (16)
| Report a problem
February 13, 2018
One day without us…
Saturday 17 February sees the national day of action for ‘One Day without us’, which celebrates the invaluable contributions migrants have made, and continue to make in the UK. Here, Provost Chris Ennew reflects on those contributions.
So what have migrants ever done for us……….
Those of you of a particular generation might recall a famous scene from Monty Python’s Life of Brian in which there is a lengthy discussion about what the Romans have ever done for the people of Judea and we encounter the immortal response from one of the characters, Reg
“All right, but apart from the sanitation, the medicine, education, wine, public order, irrigation, roads, a fresh water system, and public health, what have the Romans ever done for us?”
Several years ago, 'The Economist' posed a similar question in an article entitled “What have the immigrants ever done for us?” And they came to a remarkably similar conclusion. Of course, this being 'The Economist', the focus is a little narrow – the article reports on the positive contribution of migrants to government finances and notes that in the case of the UK, over a 15 year period, migrants made a positive net contribution of more than £4 billion to public finances while native Britons had a negative overall impact of £591 billion.
Important as this may be, it doesn’t really encompass the richness of the impact that migrants to this country and many others have had. Without you[1], we might not have Marks and Spencer, the Mini, the Muppet Show, the first woman to be awarded the Gold Medal of the Royal Astronomical Society, or multiple gold medals for long distance running. Locally in Coventry our theatrical traditions would have been so much poorer without the contribution of Ira Aldridge. And without you we might not, as a country, be able to lay claim to Graphene, The Waste Land, The Water Music or Das Kapital!
Those of you who have come to live and work in this country – and indeed in so many countries worldwide have added immensely to the economic, social, cultural and scientific lives of their adopted homes. And that why its so important that we remember and celebrate the value you bring. And for all those who have come to live in the UK, please remember, we might manage one day without you, but please don’t make it any longer!
There are a number of activities taking place on Saturday 17 February, some nationally and some locally, in support of One Day Without Us. Visit the insite feature to find out more about how you can get involved.
[1] http://www.telegraph.co.uk/expat/expatpicturegalleries/9403459/Famous-immigrants-to-the-UK.html?image=3
Execblog Resource
13 Feb 2018 12:52
| ![]() Tags: Provost
| Comments (2)
| Report a problem
Tags: Provost
| Comments (2)
| Report a problem
 Loading…

